25. Troubleshooting
In this chapter
You will learn
- a layered method that narrows any problem down to one of seven layers: server, TRex instance, TX switch, AP/Leaf/BL, fabric/DCI, firewall, data pipeline
- to read the pattern of affected streams - which streams fail together tells you where to look
- symptom, likely cause, checks and fix for each layer, with commands verified for the platform
- to capture packets with TRex (monitor, record, BPF filters, capture as a counter) and to read the pcaps
- which commands to use first on each layer
Prerequisites: Chapter 12, Chapter 13, Chapter 17, Chapter 18, Chapter 20, Chapter 24
Every frame of the platform crosses seven layers of equipment and software, and every number in Grafana passes three more pieces of software before you see it. When something looks wrong, the problem can be in any of them - including the measurement itself. This chapter gives you a method that avoids guessing: start where the symptom is visible, compare streams to find what the affected ones have in common, and work outwards layer by layer with a small set of commands per layer.
The layered method
| Layer | What belongs to it | First question |
|---|---|---|
| 1 Server | trex-rzk-01: hardware, DPDK binding, hugepages, systemd units | Does the TRex process run and see its ports? |
| 2 TRex instance | trex-mon / trex-lab: ports, service mode, EMU, streams, counters | Are streams loaded, sending, and is the instance configured to receive? |
| 3 TX switch | sw-rzk-TX1, sw-rzc-TX1, TX-to-TX fibre | Does the frame reach the right AP port and come back? |
| 4 AP, Leaf, BL | AP port, service instance, VSI, gateway, ARP | Does the Leaf map the frame into the right VSI and learn the MACs? |
| 5 Fabric, DCI | Spines, VXLAN tunnels, RAGG1 between the Border Leafs | Does the frame cross the fabric and the DCI? |
| 6 Firewall | DC-FW, ENT-FW: rules, routes, sessions, cluster | Does the firewall forward the flow? |
| 7 Data pipeline | Exporter, InfluxDB, Grafana | Does the number reach the dashboard correctly? |
Two principles make the method fast:
- Compare before you dig. A problem that hits every stream lives in a shared layer; a problem that hits one AP
lives at that AP. The stream tags (class, src_ap, dst_ap, VLAN, DC pair) in Grafana, or the read-only status script
of Chapter 20, answer the question in a minute (the console's
stats -sandstats -lshow only the first four or five pg_ids). - Confirm at the source before you blame the network. Grafana shows what the exporter wrote; the TRex console shows what TRex counted. If they disagree, the problem is in layer 7.
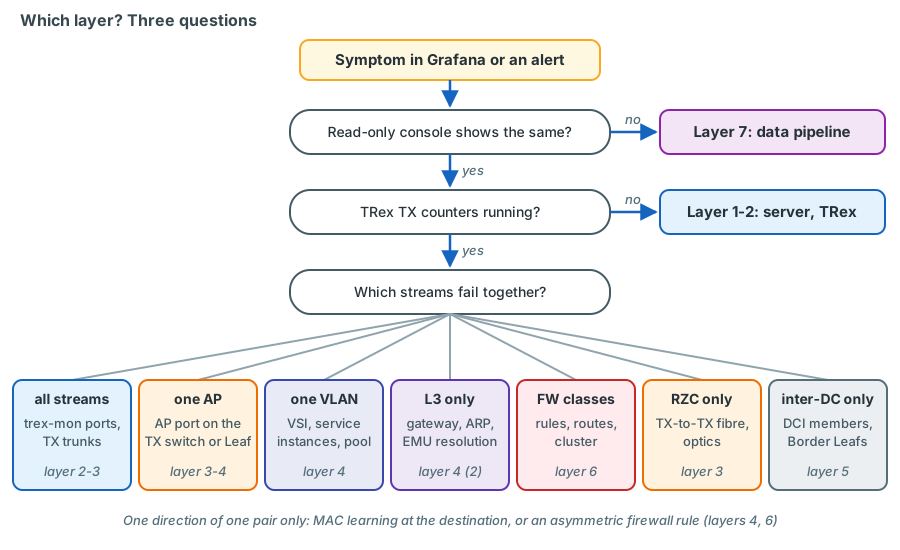
| Streams affected together | Most likely layer | Look first at |
|---|---|---|
| None in the console, but Grafana shows gaps or NoData | 7 Data pipeline | Exporter, InfluxDB health, Grafana query |
| All streams, TX counters also zero | 1 Server or 2 Instance | systemctl status trex-mon, stats -g |
| All streams, TX running, RX zero | 2 Instance (promiscuous, link) or 3 TX switch trunks | stats --ps, display interface brief |
| All streams to and from one AP | 3 TX switch AP port or 4 Leaf AP port | display qinq, AP port configuration |
| All streams of one VLAN, all APs | 4 VSI, service instances, pool | display l2vpn vsi, display l2vpn mac-address |
| L3 classes only | 4 Gateway / ARP, 2 EMU resolution | emu_show_all --4-dg, display arp vpn-instance VPN-CORE |
| L3 classes from Leaf APs only; the same classes from the BL APs work | 4 Gateway ARP through VXLAN tunnels (centralised gateway) | emu_show_all --4-dg, Layer 4 below |
Routed streams from one RZC AP: copies arrive at other RZC APs (RX greater than TX, latency dup errors) |
4 Gateway MAC unknown on that RZC Leaf (flooding) | display evpn route mac on the Leaf |
| Firewall classes only | 6 Firewall | Firewall logs, routing table, cluster state (a failover leaves streams on the old member MAC) |
| All RZC streams (latency spikes or loss) | 3 TX-to-TX fibre | Inter-DC port counters and optics |
| Inter-DC streams only | 5 DCI | RAGG1 members, Border Leafs |
| One direction of one pair | 4 MAC learning at the destination, 6 asymmetric rule | display l2vpn mac-address, firewall rule |
| Constant small loss on many streams | 2 RX overload, 4 duplicate address, 5 congested link | stats -g (rx_cpu_util), display mac-address mac-move |
Use the read-only console for diagnosis
./trex-console -p 4501 --async_port 4500 -r (add --emu for the EMU commands) shows everything trex-mon knows
and cannot change anything. Open a writable console only for a planned change (Chapter 24).
Layer 1 - TRex server
| Symptom | Likely cause | Checks | Fix |
|---|---|---|---|
| trex-mon restarts in a loop | Configuration error, hugepages, binding | systemctl status trex-mon; the unit's log file (/var/log/trex/trex-mon.log in the reference units) |
Fix the cause shown at the end of the log |
_t-rex-64 aborts: GLIBCXX_3.4.30 not found |
Bundled libstdc++ (v3.06 and later) older than the system libraries | ./t-rex-64 --help in the release directory |
Point so/x86_64/libstdc++.so.6 to the system library (symlink, Chapter 17) |
| EAL initialisation fails, "not enough hugepages" | Hugepages not reserved, or both instances need more than the pool | grep -E 'HugePages_(Total|Free)' /proc/meminfo, cat /proc/cmdline |
hugepages= on the kernel command line; sum of limit_memory below the pool |
| Ports missing or bound to the kernel driver | vfio-pci not usable: IOMMU off (VT-d disabled in the BIOS - the HPE "Low Latency" workload profile disables it - or intel_iommu=on missing) |
./dpdk_setup_ports.py -s; cat /proc/cmdline |
Workload Profile Custom with VT-d enabled (Chapter 17), intel_iommu=on; restart the instance - TRex binds its ports at start (dpdk_setup_ports.py -i only writes a configuration) |
| Port present, link never up, optic rejected | X710 accepts only Intel-coded SFP+ modules (TRex manual, Table 6 "SFP+ support") | Before binding: dmesg | grep i40e; on the TX switch display transceiver interface |
Intel-coded optic or a tested passive DAC |
| Second instance: "address already in use" | Same ZMQ ports or prefix as the first | Compare prefix, zmq_pub_port, zmq_rpc_port in both configuration files |
Distinct values per instance |
| Low performance, RX drops at modest rates | NIC and TRex threads on different NUMA nodes, power-saving C-states | stats -c; cat /sys/bus/pci/devices/0000:<bdf>/numa_node; lscpu; tuned-adm active |
BIOS: the Low Latency settings kept under Workload Profile Custom, with VT-d enabled again (Chapter 17); threads on the NIC's node |
| Host firewall inactive after a TRex start | trex-cfg stops firewalld at every start of t-rex-64 (Red Hat-family systems) |
firewall-cmd --state |
Host-protection decision of Chapter 17; check after every start (Chapter 24) |
stats --ps: link status DOWN |
Cable, optic, TX switch port shut | display interface brief and display transceiver diagnosis interface on the TX switch |
Replace or clean; undo shutdown |
stats --ps (port status) shows per port the driver, link status and speed, promiscuous and multicast state, layer
mode, source MAC and IPv4, destination and ARP resolution, VLAN, NUMA node and RX filter mode (TRex source
trex/common/trex_port.py).
Layer 2 - TRex instance
| Symptom | Likely cause | Checks | Fix |
|---|---|---|---|
Console: port(s) [n]: must be acquired |
Read-only console, or another client owns the ports | stats -g (which instance?), how the console was started |
Use the right console; never force-acquire trex-mon |
Console: port(s) [n]: must be under service mode |
l3, arp, ping need service mode |
Prompt shows no (service) |
service --port n first, service --port n --off afterwards |
| trex-mon: RX = 0 on all L2 streams, EMU clients unresolved | Ports not promiscuous: frames to EMU client MACs are dropped by the NIC | portattr (promiscuous: off) |
portattr -a --prom on (planned change on trex-mon) |
| L3 streams RX = 0, L2 fine | Gateway not resolved by EMU | emu_show_all --4-dg (default-gateway table) |
Check the VLAN on the AP port, the gateway, filtered service mode; for clients behind Leaf APs see the centralised-gateway row in Layer 4 |
| EMU sees no ARP at all | Ports not in filtered service mode for EMU | Prompt trex(service-filtered)> missing |
service --emu |
| Start rejected: "Failed allocating statistic counter. Probably all are used for this rule type." (latency stream) | The instance already runs 128 latency streams - the limit counts per instance, across all ports and profiles | get_active_pgids()['latency'] from a read-only Python client (the console tables show only 4-5 pg_ids) |
Remove leftover ad-hoc streams; trex-mon budget at most 120 |
| The same message for a flow-stat stream | All flow-stat counters in use: 127 on the X710 in hardware mode (trex-lab), 1023 with --software |
get_active_pgids()['flow_stats'] |
Remove streams; fewer pg_ids per lab test |
| "For payload rules: Can't have two streams with same pg_id, or same stream on more than one port" | Duplicate latency pg_id | The profile | One pg_id per latency stream and port |
| "Need at least 16 payload bytes for payload rules" | Latency frame too small for the 16-byte signature | Frame size | At least 62 bytes without FCS (one tag), 66 (two tags) |
| Lab: flow statistics fail for double-tagged frames | Hardware mode supports IPv4 with at most one VLAN tag | Profile on a lab port | Single-tagged frames on pinned ports |
-m / update does not change a stream's rate |
Latency streams ignore the multiplier | Stream type | Remove the stream and add it again with the new pps (its counters restart) |
| trex-mon latency implausibly high or jumpy on every stream, loss counters plausible | c of 2 or more in software mode: TRex runs in MULTI_QUE mode, where latency is measured indirectly and is not accurate |
grep 'queues mode' /var/log/trex/trex-mon.log - expected "set dpdk queues mode to ONE_QUE" |
c: 1 and one thread per dual_if in trex_mon.yaml, restart in a window (Chapter 17) |
get_pgid_stats error "Asking information for too many packet group IDs" |
More than 1024 pg_ids in one request | Exporter code | Query in chunks |
| Small loss reported right after a stop | Frames arrived after the RX filters were removed (rx_delay_ms, 10 ms default) |
Global rx_err / old_flow counters |
Larger rx_delay_ms for long paths |
| All counters at zero, streams and EMU clients gone | TRex restarted (crash, systemd restart, upgrade) | systemctl status, the log, the time of the last start |
Re-apply the monitoring profile (planned: the exporter's supervisor thread does this automatically once the server accepts connections again); the exporter must treat the reset as a restart, not as loss |
| Monitoring streams stopped or removed, EMU clients still there | disconnect in a writable session (stops the owned ports, stop_traffic=True by default), reset, or a tool against 4501 such as the bundled ./ndr (calls reset() on all ports) |
profiles, stats --ps (port state); who was connected at that time |
Re-apply the profile; leave consoles with quit; never run ./ndr on this server (Chapter 24) |
| All EMU clients re-created at one moment, short loss on every stream | emu_load_profile (or emu_remove_profile): loading a profile first removes all namespaces and clients |
emu_show_all; change log |
Incremental EMU changes (Chapter 21) |
| Constant small loss everywhere on trex-mon | RX core overloaded (software mode) | stats -g: rx_cpu_util, queue_full; stats -c |
Find the extra traffic (flood?) or reduce the profile |
The error texts and the queue-mode line are quoted from the TRex sources (src/stx/stl/trex_stl_fs.cpp,
src/trex_modes.cpp, trex/common/trex_psv.py), so you can search for them in the console output and in logs.
confirm on the bench EMU counters per namespace:
emu_arp_show_counters -p 0 --vlan 3101 1314 --tpid 0x8100 0x8100 and the client view
emu_show_client_info -p 0 --vlan 3101 1314 --tpid 0x8100 0x8100 --mac 02:54:52:01:05:22. The namespace key must match
the one the profile created (port, both tags, both TPIDs). The client view contains the default-gateway state (dgw,
with resolve and the resolved MAC).
Layer 3 - TX switch
| Symptom | Likely cause | Checks | Fix |
|---|---|---|---|
| Streams to one AP: TX fine, RX = 0; the Leaf has learned the TRex MAC | AP port without qinq enable: the Leaf's frames carry VLAN 1314, an access port drops tagged frames whose VLAN differs from the PVID (L2 Configuration Guide PDF pp. 140-141) |
display qinq (L2 CR p. 277) |
qinq enable on the AP port |
| All streams of one RZC AP RX = 0 | S-VLAN missing on the TX-to-TX trunk or on the monitoring trunks | display vlan 3204 (L2 CR p. 193); display current-configuration interface HundredGigE1/2/1 |
Permit the S-VLAN on both TX switches |
| Lab frames disappear after re-pinning | Stale static MAC entry; static source check drops the frames | display mac-address static vlan <S-VLAN> (L2 CR p. 11) |
Remove the old entries, add the new ones |
| A TRex MAC on an unexpected port | Wrong pin, wrong source port, MAC move | display mac-address vlan 3101, display mac-address mac-move (L2 CR pp. 11, 14) |
Correct the pin or the profile |
| Ports blocked, drops counted as "STP non-forwarding state" | STP enabled (factory defaults enable it) | display stp brief (L2 CR p. 294), display packet-drop interface (p. 64) |
undo stp global enable |
| BPDUs from a Leaf seen by TRex | Expected: flooded as data inside the AP's S-VLAN confirm on the bench | Capture on the TRex port | Harmless; optional bpdu-drop any on AP ports (L2 CR p. 292) |
| Latency spikes or loss on all RZC streams | TX-to-TX fibre or optics | display transceiver diagnosis interface HundredGigE1/2/1, display transceiver alarm interface HundredGigE1/2/1 (Fundamentals CR pp. 289-291), display interface HundredGigE1/2/1 |
Clean or replace optics; fibre provider |
| Loss while a lab test runs | Egress congestion: lab plus monitoring on one AP or on the fibre | display packet-drop interface, display counters rate outbound interface |
Reduce the lab rate |
Checking one AP end to end on the TX switch
verified L2 CR PDF pp. 11, 43, 47, 193, 277
<sw-rzk-TX1> display interface Ten-GigabitEthernet 1/1/1 brief
<sw-rzk-TX1> display qinq interface Ten-GigabitEthernet 1/1/1
<sw-rzk-TX1> display vlan 3101
<sw-rzk-TX1> display mac-address vlan 3101
<sw-rzk-TX1> display counters rate inbound interface Ten-GigabitEthernet 1/1/1
Expected: the AP port is up at 10G and QinQ-enabled; VLAN 3101 has the AP port and a pinned lab port as untagged members and the monitoring trunks as tagged members; the MAC table shows the TRex client MACs on the trunk (or lab) port and the Leaf-side MACs (gateway, remote clients) on the AP port.
Layer 4 - Attachment point, Leaf and Border Leaf
| Symptom | Likely cause | Checks | Fix |
|---|---|---|---|
| One VLAN dead on one AP, other VLANs fine | VLAN not permitted on the AP trunk or service instance missing | display current-configuration interface Ten-GigabitEthernet1/3/1 (Fundamentals CR p. 179); display l2vpn service-instance interface Ten-GigabitEthernet1/3/1 verbose (VXLAN CR p. 15) |
Add port trunk permit vlan and the service instance (Chapter 13) |
| No TRex MAC in the VSI | VSI missing or not mapped | display l2vpn vsi name VPN-1314 verbose (VXLAN CR p. 17); display l2vpn mac-address vsi VPN-1314 (p. 13) |
Correct the mapping |
| Local MAC present, remote MAC missing | EVPN route not received | display evpn route mac vsi VPN-1314 (EVPN CR p. 23) |
Network team: BGP EVPN |
| L3 streams RX = 0 | sw-rzk-BL has no ARP entry for the TRex client, or a wrong one | display arp vpn-instance VPN-CORE (L3 IP Services CR p. 33) |
EMU / port ARP, VLAN on the AP, duplicate address |
Clients behind a Leaf AP do not resolve 10.3.14.1 (emu_show_all --4-dg), clients behind the BL APs do |
Centralised EVPN gateway: when remote ARP learning is disabled, the gateway does not answer ARP requests for its MAC that arrive through VXLAN tunnels; HPE requires ARP flood suppression on the VTEPs (EVPN CG PDF p. 28). At LVR no VSI has arp suppression enable and remote ARP learning is at its default confirm on device in rollout phase 3 |
display arp vpn-instance VPN-CORE on sw-rzk-BL (no entry for the client); EMU default-gateway state |
Network team: arp suppression enable in VSI view on the Leafs (VXLAN CR PDF pp. 5-6, a production change), or run the L3 classes from the BL APs |
Routed streams from an RZC AP are copied to other RZC APs (RX greater than TX, latency dup errors); unknown-unicast load in VLAN 1314 |
The RZC Leaf has no EVPN MAC entry for the gateway MAC ec9b-8b67-37b8 of sw-rzk-BL and floods the frames (seen on SW-RZC-L21 in February 2025) confirm on device | display evpn route mac on the Leaf (EVPN CR p. 23; the command of the SW-RZC-L21 diag file): ec9b-8b67-37b8 should appear with flags BG, as on sw-rzc-BL |
Network team: EVPN advertisement of the gateway MAC; a commissioning check for every RZC AP before the L3 classes go live |
| Gateway MAC questions | Which MAC should TRex resolve? | display interface vsi-interface 914 - "hardware address" (VXLAN CR pp. 59-60) |
- |
| L3-ENTFW RX = 0 | No route to the firewall zone in VPN-CORE, or - with the default firewall-zone option B - VLAN 4003 missing on the K-BL / C-BL AP port | display ip routing-table vpn-instance VPN-CORE 10.9.90.0 24 (L3 IP Routing CR p. 26); display ospf 1 peer (p. 181); on sw-rzk-BL display l2vpn service-instance interface Ten-GigabitEthernet1/3/6 verbose (VXLAN CR p. 15): instance 4003 bound to VPN-4003, the same on sw-rzc-BL Ten-GigabitEthernet1/3/14 |
Firewall advertises the zone, or static route; service instance 4003 on the BL AP port (Chapter 15) |
| L3 lab test stops after about 20 minutes | Dynamic ARP entry aged (20 min default, probes unanswered) | display arp timer aging (L3 IP Services CR p. 30) |
Re-resolve, or verify gratuitous ARP (Chapter 22, T2) |
Layer 5 - Fabric and DCI
| Symptom | Likely cause | Checks | Fix |
|---|---|---|---|
| Inter-DC streams only: loss or latency step | DCI member link, MACsec, Border Leaf | On sw-rzk-BL: display interface HundredGigE1/2/1, display interface HundredGigE2/2/1 (RAGG1 members), display counters rate outbound interface HundredGigE1/2/1 |
Network team; correlate with changes |
| Streams of one Leaf only, all classes | Leaf uplinks, spine | display interface brief on the Leaf; display vxlan tunnel (VXLAN CR p. 21) |
Network team |
| Loss bursts on many streams at the same moment | Convergence event (link, IRF member, routing) | Switch logs display logbuffer (NMM CR p. 423) |
See Chapter 23 |
| MAC-move messages, sporadic loss on one client | The same MAC sent from two places | display mac-address mac-move |
Find the duplicate source (Chapter 24) |
Layer 6 - Firewall
The firewalls are configured by the LVR firewall team; you diagnose with them, using the logs filtered by the TRex objects.
| Symptom | Likely cause | What to ask the firewall team |
|---|---|---|
| L3-DCFW or L3-ENTFW streams RX = 0 in both directions | Rule missing, below a cleanup rule, or NAT applied | Drops for the TRex objects in the log; rule order; "no NAT" for TRex objects |
| One direction works, the other does not | Asymmetric rule or route; anti-spoofing on the zone interface | Log entries for the reverse direction; anti-spoofing drops |
| Anti-spoofing drops in ASTF variant 2 | Routed ranges 10.9.92.0/24 and 10.9.93.0/24 not part of the interface topology | Topology of inside and zone interfaces |
| Latency step on firewall streams at one moment | Active member changed (other data centre) | Cluster state and failover time; annotate - expected behaviour. If some directions also keep losing packets, see the next row |
| After a failover, streams addressed to a firewall MAC keep losing packets (L3-DCFW both directions, zone-side L3-ENTFW, lab ports in L3 mode); L2 and L3-BL fine | The cluster answered ARP with the active member's MAC (February 2025: 10.9.0.22 and 10.9.0.35 resolved to member MACs, no virtual MAC); the streams still carry the old member's MAC. EMU learns the new MAC at once from a gratuitous ARP request, otherwise only at its next periodic query (every 60 s by default) | Cluster state history; how the cluster announces the new MAC; whether a virtual MAC can be used. On the TRex side compare emu_show_all --4-dg with the stream MACs (force a query with emu_arp_cmd_query ... --garp off if EMU still shows the old MAC) and rebuild the affected streams - planned: the gateway-MAC tracker, event gateway_mac_changed; lab ports re-resolve (Chapter 15, Chapter 23, Chapter 24) |
| Latency streams through the firewall dropped, flow-stat streams of the same pair pass | Latency stream built with a computed UDP checksum: the per-packet signature makes it wrong, and the firewall verifies it | Drops for the TRex objects with a checksum reason in the log; fix in the profile: latency streams with UDP(chksum=0) |
| New streams fail after an address or pin change | Stale connection entries (UDP default 40 s) | Connection table for the TRex objects |
| Latency rises with load before loss | Inspection or CPU load | Whether Threat Prevention inspects TRex traffic (open decision) |
Layer 7 - Data pipeline
| Symptom | Likely cause | Checks | Fix |
|---|---|---|---|
| All panels NoData, the TRex console shows traffic | Exporter not running, InfluxDB down, token | systemctl status trexctl-exporter (planned unit) and its log; influx ping; curl -s http://127.0.0.1:8086/health |
Start the service, renew the token |
| Gaps in all panels | Exporter stalled, InfluxDB slow or disk full | df -h /data; journalctl -u influxdb; exporter lag on "TRex - Ports and server" |
Free space, retention, restart |
| One panel NoData, others fine | Query, variable, time range or a renamed tag | Panel menu, Inspect, Query; "Query inspector" in the editor | Correct the query or variable |
| Data source error on every panel | URL or token of the data source | Data source settings, Save & test ("Data source is working") | Correct the settings |
| Sudden loss on all streams at one moment, console shows none | Counter reset (TRex restart) misread as loss | Time of the TRex restart | Exporter must detect the restart |
| Alert fires, dashboard looks fine | Alert query differs from the panel, pending period | Alert rule state and its query | Align the rule (Chapter 19) |
A quick check that data is arriving, independent of Grafana:
confirm on device InfluxDB OSS 2.x CLI influx query; bucket and measurement names
of the planned data model
influx query 'from(bucket: "trex") |> range(start: -5m) |> filter(fn: (r) => r._measurement == "trex_stream") |> group() |> count()'
influx needs the organisation and a token, from the active CLI configuration or --org and --token. A count of
zero with TRex running means the exporter does not write; a growing count means the problem is in Grafana.
Capture techniques
TRex capture
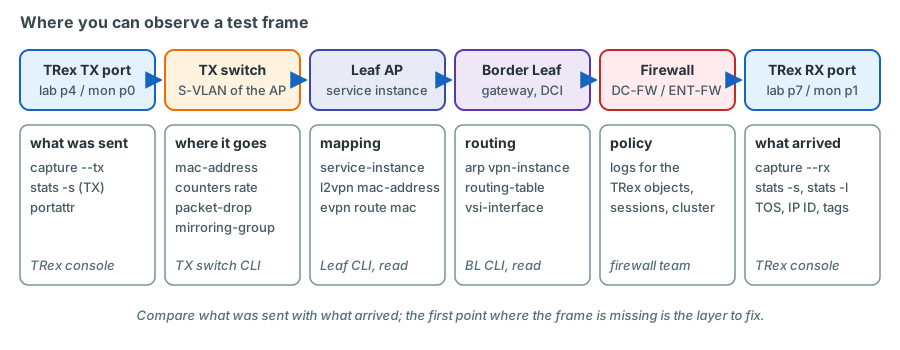
TRex can copy received (and transmitted) frames of a port into a server-side queue with a BPF filter, and show them live (monitor) or save them as a pcap (record). The TRex stateless guide describes capturing in service mode; on a lab port in hardware mode, service mode is what forwards all frames to the RX core.
verified syntax: TRex stateless guide, "Packet capturing" (console usage); console options in the
TRex source trex/utils/parsing_opts.py
trex> service --port 3
trex(service)> capture monitor start --rx 3 -v -f arp
trex(service)> capture monitor stop
trex(service)> capture record start --rx 3 --limit 200 -f vlan 1314 and udp dst port 32009
trex(service)> capture
trex(service)> capture record stop --id 2 -o /tmp/p7-rx.pcap
trex(service)> service --port 3 --off
| Command | Purpose |
|---|---|
capture monitor start --rx 3 -v |
Live view, full Scapy dissection of every frame (-v); for low rates only |
capture record start --rx 3 --limit 200 |
Fixed queue of 200 frames; capture shows the status; capture record stop --id N -o file writes the pcap |
-f <BPF> |
Filter, tcpdump syntax; the TRex BPF implementation is JIT-compiled and cheap for non-matching traffic |
--limit 0 |
Capture as a counter: the "Matched" column of capture counts matching frames without storing them |
--tx 0 |
Capture what a port sends - useful to prove what TRex transmitted |
Filters for tagged frames. On a pinned lab port frames carry one tag: vlan 1314 and udp dst port 32009. On a
monitoring port they carry two: vlan 3101 and vlan 1314 and udp - each vlan keyword moves the decoding by one tag
(pcap-filter semantics; confirm on the bench with TRex). Without vlan in the filter,
a tagged frame never matches udp.
trex-mon. Capturing on the monitoring instance is possible in principle, but it is the production instance: use a tight filter, a small limit and a short time, validate the procedure on the bench first, and never switch its ports to full service mode - EMU depends on the filtered mode. When possible, reproduce the problem on a lab port instead.
Reading the pcap
confirm on device tcpdump must be installed on the server
-e prints the Ethernet header with the VLAN tags, -v the IP header with TOS, TTL and ID. Without tcpdump on the
server, Scapy from the TRex Python environment reads the same file (rdpcap). For Wireshark, copy the file to a
workstation; useful display filters: vlan.id == 1314, udp.dstport == 32009, ip.dsfield.dscp == 46, arp,
ip.id >= 0xfc00.
What TRex frames look like: TRex rewrites the IPv4 ID of its statistics streams. The stateless guide ("Per stream
statistics") names the reserved range 0xff00-0xffff; the v3.x source reserves 0xFC00-0xFFFF - a flow-stat stream
carries 0xFC00 plus an internal counter ID (not the pg_id), every latency stream carries 0xFFFF
(src/stx/stl/trex_stl_fs.cpp). Latency frames end with a 16-byte signature (an internal ID, the sequence number and
the TX timestamp). TRex also sets bit 0 of the TOS byte on both kinds, so a stream built with TOS 0xB8 is captured as
0xB9 and one built with TOS 0 as 0x01. A frame with an IP ID below 0xFC00 in a TRex VLAN did not come from a TRex
statistics stream.
Mirroring on the TX switch
The TX switches carry only TRex traffic, so a local mirror is a low-risk way to look at an AP link from outside TRex - if a capture host is connected to a free port.
verified NMM CR PDF pp. 354-362 confirm on device which tags the mirrored copies carry on a QinQ port
system-view
 mirroring-group 1 local
 mirroring-group 1 mirroring-port Ten-GigabitEthernet1/1/1 both
 mirroring-group 1 monitor-port Ten-GigabitEthernet1/1/20
 display mirroring-group all
| Line | What it does | Why |
|---|---|---|
mirroring-group 1 local |
Creates local mirroring group 1 | Source and destination on the same switch |
mirroring-port Ten-GigabitEthernet1/1/1 both |
Copies both directions of AP K-L11 | The frames exactly as the Leaf sends and receives them |
monitor-port Ten-GigabitEthernet1/1/20 |
Sends the copies to a free port with the capture host (unused ports are shut down: undo shutdown first) |
Not a TRex port - the copies must not enter the monitoring |
display mirroring-group all |
Shows the configuration | Verify, and remove the group after the capture |
The most useful commands per layer
| Layer | Command | Source |
|---|---|---|
| 1 | systemctl status trex-mon / trex-lab; the unit log file |
systemd units (Chapter 17) |
| 1 | ./dpdk_setup_ports.py -s |
TRex manual |
| 1 | grep -E 'HugePages_(Total|Free)' /proc/meminfo |
Linux |
| 1 | firewall-cmd --state after every TRex start |
RHEL; trex-core scripts/trex-cfg |
| 2 | grep 'queues mode' /var/log/trex/trex-mon.log (expected: ONE_QUE) |
trex-core src/trex_modes.cpp |
| 2 | stats -g, stats -p, stats --ps, stats -s, stats -l, stats --lh, stats -c, stats -m, stats -x |
TRex console (pg_id tables: first 4-5 pg_ids only) |
| 2 | get_active_pgids(), get_pgid_stats() from a read-only client |
TRex STL Python API |
| 2 | tui (s streams, l latency, h histogram, q quit) |
TRex console |
| 2 | portattr, service, service --emu, service --off |
TRex console |
| 2 | emu_show_all, emu_show_all --4-dg |
TRex EMU console |
| 2 | capture monitor start, capture record start, capture record stop, capture |
TRex console |
| 3 | display interface brief, display qinq, display vlan, display mac-address, display mac-address mac-move |
L2 CR pp. 47, 277, 193, 11, 14 |
| 3 | display counters rate { inbound | outbound } interface, display packet-drop interface |
L2 CR pp. 43, 64 |
| 3 | display transceiver diagnosis interface, display transceiver alarm interface |
Fundamentals CR pp. 289-291 |
| 4 | display l2vpn service-instance, display l2vpn vsi, display l2vpn mac-address |
VXLAN CR pp. 15, 17, 13 |
| 4 | display evpn route mac (gateway MAC ec9b-8b67-37b8 on RZC Leafs) |
EVPN CR p. 23 |
| 4 | display arp vpn-instance VPN-CORE, display arp timer aging |
L3 IP Services CR pp. 33, 30 |
| 4 | display ip routing-table vpn-instance VPN-CORE <prefix> <len>, display ospf 1 peer |
L3 IP Routing CR pp. 26, 181 |
| 4 | display interface vsi-interface 914 |
VXLAN CR p. 59 |
| 5 | display vxlan tunnel, display logbuffer |
VXLAN CR p. 21, NMM CR p. 423 |
| 7 | influx ping, curl -s http://127.0.0.1:8086/health, influx query |
InfluxDB OSS 2.x CLI and API |
| 7 | systemctl status influxdb grafana-server, df -h /data |
Linux, Grafana and InfluxDB packages |
Key takeaways
- Start where the symptom is visible, compare the affected streams, then work outwards: server, instance, TX switch, AP/Leaf/BL, fabric/DCI, firewall, data pipeline.
- The pattern decides the layer: all streams - shared component; one AP - that AP; one VLAN - its VSI; L3 only - the gateway; firewall classes - the firewall; RZC only - the TX-to-TX fibre; console fine but Grafana not - the pipeline.
- Diagnose trex-mon with a read-only console; most TRex error messages name their cause directly and can be searched in the sources.
- On the TX switch, a missing
qinq enablebreaks exactly one direction; a missing S-VLAN on the inter-DC trunk breaks one RZC AP; a stale static MAC entry black-holes a lab port. - On Leaf and Border Leaf, the chain service instance - VSI - MAC table - EVPN route - ARP entry - route shows where a frame stops. Two fabric-specific checks belong to commissioning: gateway ARP from a Leaf AP (centralised gateway) and the gateway MAC on every RZC Leaf.
- Firewall diagnosis is teamwork with the firewall team, based on logs filtered by the TRex objects; after a failover, streams addressed to a firewall MAC must be rebuilt (planned: by the gateway-MAC tracker) unless the cluster uses a virtual MAC.
- On trex-mon, "set dpdk queues mode to ONE_QUE" in the log is the precondition for accurate latency (
c: 1). - TRex capture (monitor, record, BPF, capture as a counter) shows what really arrives; IPv4 IDs from 0xFC00 (0xFFFF for latency streams), TOS bit 0 and the 16-byte signature identify TRex statistics frames.
Check your understanding
1. Grafana shows NoData for all panels since 02:00, but stats -l in the read-only console shows normal latency. Where do you look and in which order?
The measurement works, so the problem is in layer 7. Check the exporter service and its log, then InfluxDB
(influx ping, /health, free space on /data), then whether points arrive (influx query ... count()); only if
they do, look at the Grafana data source (Save & test) and the queries.
2. All streams to and from AP C-L13 have RX = 0; all other RZC APs are fine. Which layers can you exclude, and what are the first checks?
The server, the instance, the TX-to-TX fibre, the DCI and the firewalls are shared by healthy streams, so they are
excluded. The cause is at AP C-L13: the AP port on sw-rzc-TX1 (display interface brief, display qinq), the
S-VLAN 3203 on the trunks (display vlan 3203), the optics, and the Leaf port with its service instances.
3. Streams towards K-L41 have RX = 0, but display l2vpn mac-address vsi VPN-1314 on sw-rzk-L41 shows the TRex MAC on the AP port. What is the most likely error on the TX switch?
The AP port lacks qinq enable. Frames from TRex lose their S-tag on the access port and reach the Leaf (so it
learns the MAC), but the Leaf's frames carry VLAN 1314 and an access port drops tagged frames whose VLAN differs from
the PVID. display qinq shows whether the port is QinQ-enabled.
4. Only L3-BL and L3-ENTFW streams fail; L2 streams in the same VLANs are fine. What do you check?
The gateway resolution: emu_show_all --4-dg on trex-mon (is the gateway of VLAN 1314 resolved?), the ARP entries
for the TRex clients on sw-rzk-BL (display arp vpn-instance VPN-CORE) and, for L3-ENTFW, the route to the zone
and the firewall. L2 working proves that the AP, the VSI and the fabric are fine.
5. A latency spike appears simultaneously on every stream with an RZC source or destination, whatever the class. What is the common element?
The TX-to-TX fibre: every frame to or from an RZC AP crosses it, regardless of class, and RZK-only streams do not.
Check the inter-DC ports and optics on both TX switches (display interface, display transceiver diagnosis
interface, display packet-drop interface) and whether a lab test was loading the fibre.
6. Adding a new latency stream on trex-mon fails with \"Failed allocating statistic counter\". The budget table says 74 latency streams are configured. What else could have happened?
The instance holds more latency streams than the profile documents - for example ad-hoc streams under other profile
IDs that were never removed. get_active_pgids() from a read-only Python client lists all active latency pg_ids
(the console's stats -l shows only five); profiles in the console shows which profile IDs exist. Remove the
leftovers. The limit is 128 per instance.
7. You want to see whether the firewall re-marks DSCP on the L3-ENTFW path. Where do you capture and with which filter?
On the receiving TRex port after the firewall - for a lab test the zone-side lab port (port 2 = p6 in trex-lab,
pinned to FWZ, so the zone frames arrive single-tagged with VLAN 4003), in service mode, with
capture record start --rx 2 --limit 40 -f vlan 4003 and udp dst port 32005 (with firewall-zone option A the
filter would name VLAN 1420), then read the TOS byte in the pcap: EF arrives unchanged as 0xB9, because TRex itself
sets bit 0. Capturing on the sending side would only show what TRex sent.
8. After the trex-mon configuration was changed, all latency values are higher and jumpier than the baseline, while loss looks normal. What do you check first?
The queue mode in the start-up log: grep 'queues mode' /var/log/trex/trex-mon.log. With c: 1 in software mode
TRex prints "set dpdk queues mode to ONE_QUE" and the RX core reads the receive queue directly. With c of 2 or more
it uses MULTI_QUE, where the data-plane cores hand latency packets to the RX core and latency is not accurate. Set
c: 1 (one thread per dual_if) and restart trex-mon in a window.
References
- TRex stateless guide (https://trex-tgn.cisco.com/trex/doc/trex_stateless.html): "Port service mode" (filter modes), "Packet capturing" (BPF filtering, console usage, capture as a counter), "Per stream statistics" (IPv4 ID range, Table 14), "Per stream latency/jitter/packet errors" (limitations).
- TRex manual (https://trex-tgn.cisco.com/trex/doc/trex_manual.html): Table 6 "SFP+ support" (X710 with Intel SFP+
only), "Platform YAML (--cfg argument)", "Command line options" (
--software,--no-hw-flow-stat). - TRex EMU guide (https://trex-tgn.cisco.com/trex/doc/trex_emu.html): console commands
emu_show_all,emu_show_client_info,emu_arp_show_counters. - TRex STL Python API (cp_stl_docs):
get_pgid_stats(1024 pg_ids per call,rx_err,old_flow),stop/wait_on_traffic(rx_delay_ms). - TRex source (trex-core master):
src/stx/stl/trex_stl_fs.cpp(flow-stat error messages, reserved IP IDs, TOS bit 0),src/trex_modes.cpp("set dpdk queues mode to ..."),scripts/trex-cfg(stops firewalld),scripts/automation/trex_control_plane/interactive/trex/common/trex_psv.py(port state messages),.../trex/common/trex_port.py(port status fields),.../trex/common/trex_client.py(disconnect()),.../trex/utils/parsing_opts.py(console options),.../trex/emu/trex_emu_client.py(load_profileremoves the existing profile first),.../trex/stl/trex_stl_client.py(_show_streams_stats,_show_flow_latency_stats: at most four or five pg_ids),.../trex/examples/stl/stl_ndr_bench_tool.py(default port,reset()). - HPE FlexFabric 5950 Layer 2 - LAN Switching Command Reference R630x: PDF pp. 11, 14, 43, 47, 64, 193, 277, 292, 294.
- HPE FlexFabric 5950 Layer 2 - LAN Switching Configuration Guide R630x: PDF pp. 140-141 (frame handling per port link type), p. 24 (static source check).
- HPE FlexFabric 5950 Fundamentals Command Reference R630x: PDF p. 179 (
display current-configuration), pp. 289-291 (display transceiver). - HPE FlexFabric 5950 VXLAN Command Reference R630x: PDF pp. 5-6 (
arp suppression enable), 13, 15, 17, 21, 59-60. - HPE FlexFabric 5950 EVPN Configuration Guide R630x: PDF p. 28 (centralised EVPN gateway: ARP flood suppression on the VTEPs).
- HPE FlexFabric 5950 EVPN Command Reference R630x: PDF p. 23 (
display evpn route mac). - HPE FlexFabric 5950 Layer 3 - IP Services Command Reference R630x: PDF pp. 21, 30, 33.
- HPE FlexFabric 5950 Layer 3 - IP Routing Command Reference R630x: PDF pp. 26, 181.
- HPE FlexFabric 5950 Network Management and Monitoring Command Reference R630x: PDF pp. 354-362 (mirroring),
p. 423 (
display logbuffer). - InfluxDB OSS v2 documentation:
influx ping,GET /health,influx query. Grafana documentation: panel inspector (Query inspector), data source "Save & test", starting and restartinggrafana-server. - LVR diag files (Feb 2025): SW-RZC-L21
display evpn route mac(no entry for ec9b-8b67-37b8), sw-rzc-BL (entry with flags BG), sw-rzk-BLdisplay arp all(10.9.0.22 and 10.9.0.35 resolved to member MACs).