16. Monitoring design and budgets
In this chapter
You will learn
- which TRex limits shape the monitoring design - 128 latency streams per instance, 1023 flow-statistics streams in software mode, the software RX path, the multiplier that does not apply to latency streams - and where they are documented
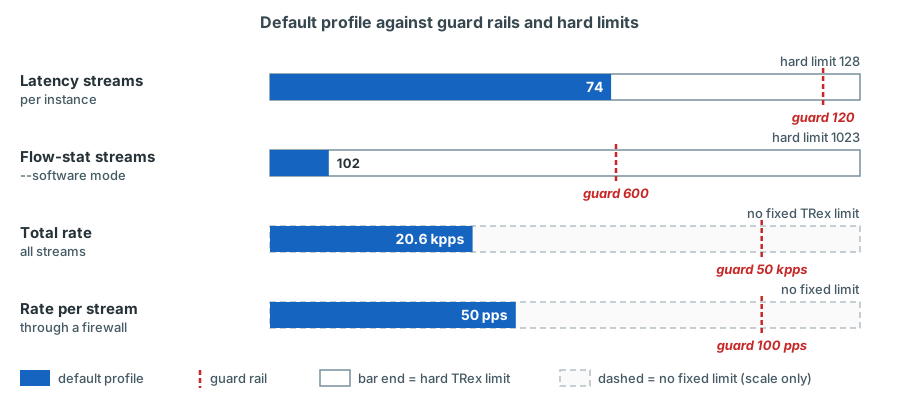
- the default monitoring profile stream by stream: 74 latency streams (including a BE reference for the DSCP classes), 102 loss-only streams, about 20.6 kpps and 22 Mbit/s, with the arithmetic behind every number
- why the profile uses 200, 100 and 50 pps and 128/256-byte frames, and what that means for loss and latency resolution
- why the pair matrix looks the way it does, and how addresses, UDP ports and pg_ids are derived
- the budget guard rails, why they exist, and how to change the matrix safely
- how the firewalls, the baseline and the fibre offsets interact with the design
- which latency statistics TRex delivers, and why an exporter must not rely on
last_maxalone
Prerequisites: Chapter 5, Chapter 14, Chapter 15
Chapter 14 explained what a stream measures. This chapter explains how many streams the platform runs, at which rate and size, between which attachment points - and why. The design is a budget: TRex can measure latency on only a limited number of streams per instance, the RX side of the monitoring instance works in software, and the firewalls are production devices. When someone asks you to "just add latency for another VLAN", this chapter gives you the numbers to answer.
The TRex limits that shape the design
| Limit | Value | Source | Consequence for LVR |
|---|---|---|---|
Latency streams per instance (STLFlowLatencyStats) |
128 concurrent, "in addition to the streams which collect per stream statistics" | TREX-STL "Per stream latency/jitter/packet errors", Limitations; trex-core src/trex_defs.h: MAX_FLOW_STATS_PAYLOAD 128 |
Latency is the scarce resource; it is spent on one carrier VLAN and the routed classes |
Flow-statistics streams (STLFlowStats, loss only) |
127 in X710 hardware mode, 1023 with --software |
TREX-STL Table 14 "Maximum concurrent streams for collecting flow statistics"; MAX_FLOW_STATS 1023, MAX_FLOW_STATS_X710 127 |
Loss can be measured on many more streams than latency |
| QinQ with flow statistics | only with --software (since v2.21); hardware mode handles at most one VLAN tag |
TREX-STL "Per stream statistics", Limitations | trex-mon must run in software mode because its frames are double-tagged |
| Software RX path | "all RX packets will be processed by software ... total rate of RX streams is significantly lower" | TREX-MAN, command line option --software |
Every received monitoring packet costs RX-core time; keep the total rate small |
| Latency stream properties | unique pg_id per stream, at least 16 bytes of payload, one TX port per stream | TREX-STL "Per stream latency/jitter/packet errors", Limitations | Each direction of each pair is its own stream with its own pg_id |
| Latency rate guidance | latency streams are processed by software; "Do not make the total rate of latency streams higher than 5 MPPS" | same section | The ~10.4 kpps of latency streams are far below this |
| Multiplier | "Global multiplier does not apply to this type of stream" | same section | A rate change of a latency stream means rebuilding the stream |
| Statistics read-out | get_pgid_stats() returns at most 1024 pg_ids per call |
TREX-API get_pgid_stats |
The whole profile (176 pg_ids) fits into one call per poll |
Why are latency streams so limited?
A flow-statistics stream only needs a counter per pg_id. A latency stream carries a 16-byte signature at the end of
its payload - an internal ID, sequence number, transmit timestamp - and the RX core has to read it, compute the latency,
update minimum, maximum, average, jitter and the histogram, and check the sequence for loss, duplicates and
reordering, for every single packet. TRex supports a fixed number of such payload-based statistics contexts
(MAX_FLOW_STATS_PAYLOAD 128) and protects the RX core by keeping latency streams out of the global multiplier.
The default monitoring profile
The default profile of trex-mon combines two kinds of streams: latency streams (L), which measure latency, jitter and loss, and loss-only flow-statistics streams (F), which measure loss only.
Latency streams: 74
| Group | Class | Pairs | Streams (x 2 directions) | pps per stream | Size | pps |
|---|---|---|---|---|---|---|
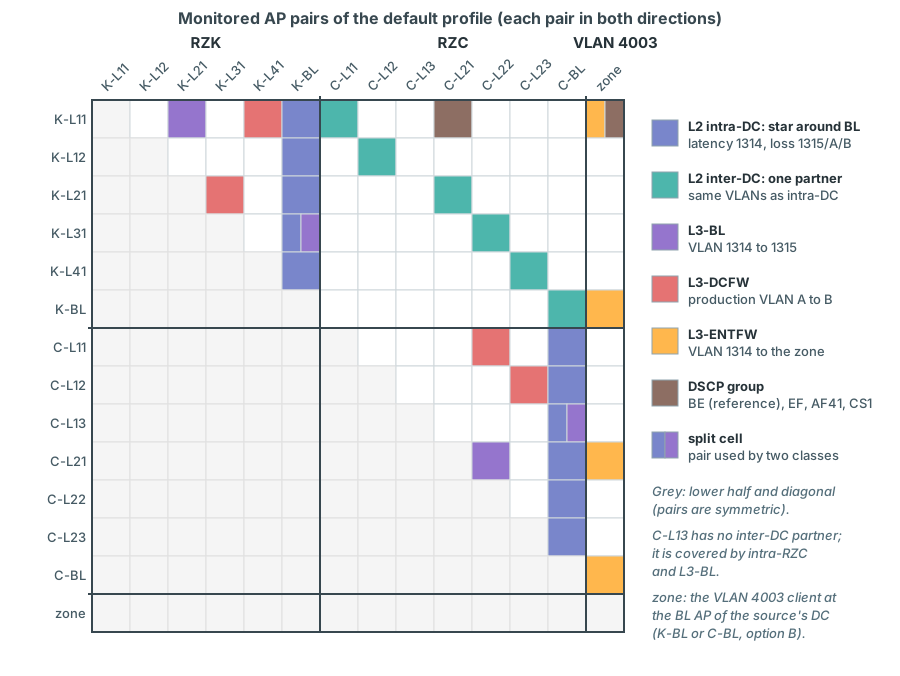
| l2-intra-rzk | L2, VLAN 1314 | 5: K-L11, K-L12, K-L21, K-L31, K-L41 each with K-BL | 10 | 200 | 128 B | 2 000 |
| l2-intra-rzc | L2, VLAN 1314 | 6: C-L11, C-L12, C-L13, C-L21, C-L22, C-L23 each with C-BL | 12 | 200 | 128 B | 2 400 |
| l2-inter-dc | L2, VLAN 1314 | 6: K-L11/C-L11, K-L12/C-L12, K-L21/C-L21, K-L31/C-L22, K-L41/C-L23, K-BL/C-BL | 12 | 200 | 128 B | 2 400 |
| l3-bl | L3-BL, 1314 to 1315 | 4: K-L11/K-L21, K-L31/K-BL, C-L21/C-L22, C-L13/C-BL | 8 | 200 | 128 B | 1 600 |
| l3-dcfw | L3-DCFW, VLAN A to B | 4: K-L11/K-L41, K-L21/K-L31, C-L12/C-L23, C-L11/C-L22 | 8 | 50 | 128 B | 400 |
| l3-entfw | L3-ENTFW, 1314 to the zone (4003) | 4: K-L11 and K-BL to the zone client at K-BL, C-L21 and C-BL to the zone client at C-BL | 8 | 50 | 128 B | 400 |
| dscp-l2-interdc | DSCP: BE, EF, AF41, CS1 | 1: K-L11/C-L21 (L2) x 4 markings | 8 | 100 | 256 B | 800 |
| dscp-entfw | DSCP: BE, EF, AF41, CS1 | 1: K-L11 to the zone client at K-BL (L3-ENTFW) x 4 markings | 8 | 50 | 256 B | 400 |
| Total | 74 | 10 400 |
The arithmetic: L2 intra-DC 11 pairs x 2 = 22; L2 inter-DC 6 x 2 = 12; L3-BL, L3-DCFW and L3-ENTFW 4 x 2 = 8 each; DSCP 2 pairs x 4 markings x 2 directions = 16. 22 + 12 + 8 + 8 + 8 + 16 = 74 of the 128 possible latency streams, leaving 54 for ad-hoc latency tests and growth. The rate: 22 x 200 + 12 x 200 + 8 x 200 (L3-BL) + 8 x 50 (L3-DCFW) + 8 x 50 (L3-ENTFW) + 8 x 100 (DSCP L2) + 8 x 50 (DSCP through the ENT-FW) = 4 400 + 2 400 + 1 600 + 400 + 400 + 800 + 400 = 10 400 pps.
The DSCP group carries a BE copy (TOS 0x00) next to EF (0xB8), AF41 (0x88) and CS1 (0x20). It is the reference that makes the comparison meaningful: the four copies of a pair differ only in the TOS byte - same pair, frame size and rate - so a systematic difference between EF and BE points to the marking, not to frame size or pair selection. The copies still have different source ports and may be hashed onto different ECMP or LACP members, so a few microseconds are not yet a finding (Chapter 14).
Loss-only streams: 102
| Group | VLANs | Pairs | Streams per VLAN | Streams | pps per stream | pps |
|---|---|---|---|---|---|---|
| l2-coverage-1315 | 1315 | pairs_from l2-intra-rzk, l2-intra-rzc and l2-inter-dc: 5 + 6 + 6 = 17 pairs |
34 | 34 | 100 | 3 400 |
| l2-coverage-prod | production VLAN A, B | the same 17 pairs | 34 | 68 | 100 | 6 800 |
| Total | 102 | 10 200 |
The loss-only coverage is grouped by VLAN, not by pair set: both groups re-use the pair lists of the three L2 latency
groups (pairs_from), so a change of the pair matrix applies to the coverage automatically. Every further VLAN under
test adds 34 loss-only streams (3 400 pps) - provided the VLAN exists in both data centres and on all APs; a VLAN that
exists only in one DC adds only its intra-DC streams, in a group of its own.
Totals
| Streams | Packets per second | Frame data (128/256 B, no FCS) | On the wire | |
|---|---|---|---|---|
| Latency | 74 | 10 400 | 9 200 x 128 B + 1 200 x 256 B = 1 484 800 B/s | |
| Loss-only | 102 | 10 200 | 10 200 x 128 B = 1 305 600 B/s | |
| Total | 176 | 20 600 (about 20.6 kpps) | 2 790 400 B/s = 22.3 Mbit/s | + 24 B per frame (FCS 4, preamble and SFD 8, gap 12): 20 600 x 24 B = 494 400 B/s = + 4.0 Mbit/s = 26.3 Mbit/s |
The 128-byte latency frames are the L2, L3-BL, L3-DCFW and L3-ENTFW streams (4 400 + 2 400 + 1 600 + 400 + 400 = 9 200 pps), the 256-byte frames the DSCP group (800 + 400 = 1 200 pps). That is the load the monitoring puts on the TRex ports - roughly a quarter of a percent of one 10G port. Even if every frame crossed the DCI or the TX-to-TX fibre twice, the monitoring would use less than 60 Mbit/s of either.
Why latency on one VLAN and loss on the others
Latency is a property of the path: two VLANs between the same two APs use the same ports, the same VTEPs and the same links - at most ECMP hashing picks a different spine or DCI member. Measuring latency in VLAN 1314 and 1315 and every production VLAN would mostly measure the same thing several times. Loss, however, is VLAN-specific in the most common failure: a missing service instance, trunk permission or VSI after a change breaks one VLAN and leaves the others untouched. So the design spends latency on one carrier VLAN (1314, which also carries all routed classes) and measures loss on every VLAN.
The arithmetic shows that there is no alternative within one instance: latency on every stream would need 34 x 4 VLANs + 8 + 8 + 8 + 16 = 176 latency streams - more than the 128 TRex supports.
Rates, resolution and packet sizes
Rates and loss resolution
A continuous stream at r pps sends a packet every 1/r seconds. A loss of n packets therefore means an outage of about n/r seconds, and the shortest outage you can see is one packet interval.
| Rate | Packet interval = loss resolution | Latency samples per 0.5 s | Used for |
|---|---|---|---|
| 200 pps | 5 ms | 100 | Latency streams in the fabric (L2, L3-BL) |
| 100 pps | 10 ms | 50 | Loss-only streams, DSCP group on the L2 pair |
| 50 pps | 20 ms | 25 | Everything through a firewall (L3-DCFW, L3-ENTFW, DSCP group through the ENT-FW) |
| 1000 pps | 1 ms | 500 | Temporary, during convergence tests |
Example: an L2 inter-DC stream at 200 pps loses 37 packets during a DCI member failure - the outage was about 185 ms, measured with 5 ms resolution. The same event on a firewall stream at 50 pps shows 9 or 10 lost packets.
Packet sizes
A monitoring frame is 128 bytes without FCS: 22 bytes of Ethernet header with two tags, 20 bytes IPv4, 8 bytes UDP and 78 bytes of payload, whose last 16 bytes are the TRex latency signature. A minimum Ethernet frame (60 bytes without FCS) would leave only 10 bytes of payload with two tags - less than the 16 bytes a latency stream needs. 128 bytes leaves a comfortable margin, is small enough to be cheap, and becomes 124 bytes on the AP link and 170 bytes inside a VXLAN tunnel - far below any MTU. The DSCP group uses 256 bytes; because every 5950 hop works store-and-forward, size changes the latency slightly (about 0.1 µs per 10G hop for 128 extra bytes), which is why the group carries its own 256-byte BE copy as the reference instead of comparing the markings with the 128-byte L2 streams (Chapter 14).
The pair matrix
Intra-DC: a star around the Border Leaf
Each Leaf AP is paired with the BL AP of its own DC, not with every other Leaf:
- Localisation. If one spoke turns red, you know which Leaf (or its AP) has a problem; if all spokes of a DC turn red, the common element - the Border Leaf, its AP or the TX switch - is the suspect.
- Scale. A star needs 2 x (n - 1) streams per VLAN; a full mesh needs n x (n - 1). For RZK (6 APs) that is 10 instead of 30 streams, for RZC (7 APs) 12 instead of 42.
- Relevance. The Border Leaf is where routed traffic is handled and where traffic leaves the DC - the gateways and both firewalls are attached there - so the Leaf-to-BL path is the path routed production flows take anyway.
Inter-DC: one partner per RZK AP
Six pairs connect every RZK AP with one RZC AP (K-L11/C-L11, K-L12/C-L12, K-L21/C-L21, K-L31/C-L22, K-L41/C-L23, K-BL/C-BL). Every inter-DC stream crosses the DCI once per direction, so the six pairs exercise the DCI from every RZK Leaf and from six of the seven RZC APs. C-L13 has no inter-DC partner; it is covered by the intra-RZC star and by L3-BL.
Routed and firewall pairs
- L3-BL uses two RZK pairs (one Leaf-Leaf, one Leaf-BL) and two RZC pairs, so the centralised-gateway effect for Chorweiler is directly comparable with Kalk.
- L3-DCFW uses two Leaf-Leaf pairs in each DC; together they show both the firewall latency and the effect of the active member's location (opposite steps for RZK and RZC pairs on a failover).
- L3-ENTFW sends from four APs - two in each DC, two Leafs and both BLs - to the firewall zone. The zone client sits
at the BL AP of the same data centre: K-L11 and K-BL send to 10.9.90.106 at K-BL, C-L21 and C-BL to 10.9.90.113 at
C-BL. The pair
[K-BL, K-BL]therefore runs from K-BL's VLAN-1314 client to K-BL's VLAN-4003 client - same TRex port and S-VLAN, different C-VLAN - and still crosses the gateway and the firewall. - DSCP sends four markings - BE as the reference, EF, AF41 and CS1 - on one inter-DC L2 pair (K-L11/C-L21) and one firewall pair (K-L11 to the zone client at K-BL).
| AP | Classes the AP takes part in (default profile) |
|---|---|
| K-L11 | L2 intra, L2 inter, L3-BL, L3-DCFW, L3-ENTFW, DSCP |
| K-L12 | L2 intra, L2 inter |
| K-L21 | L2 intra, L2 inter, L3-BL, L3-DCFW |
| K-L31 | L2 intra, L2 inter, L3-BL, L3-DCFW |
| K-L41 | L2 intra, L2 inter, L3-DCFW |
| K-BL | L2 intra (hub), L2 inter, L3-BL, L3-ENTFW (source and zone client), DSCP (zone client) |
| C-L11, C-L12, C-L23 | L2 intra, L2 inter, L3-DCFW |
| C-L13 | L2 intra, L3-BL |
| C-L21 | L2 intra, L2 inter, L3-BL, L3-ENTFW, DSCP |
| C-L22 | L2 intra, L2 inter, L3-BL, L3-DCFW |
| C-BL | L2 intra (hub), L2 inter, L3-BL, L3-ENTFW (source and zone client) |
With firewall-zone option A, the alternative, the zone clients at K-BL and C-BL would be replaced by one zone client at
the attachment point FW (index 14), the destination of all L3-ENTFW and DSCP-ENTFW pairs
(Chapter 15).
Deterministic addressing, ports and IDs
Everything that identifies a stream is computed from the inventory, so that the same stream always gets the same addresses, ports and pg_id - after a restart, after a rebuild, after a server reinstallation.
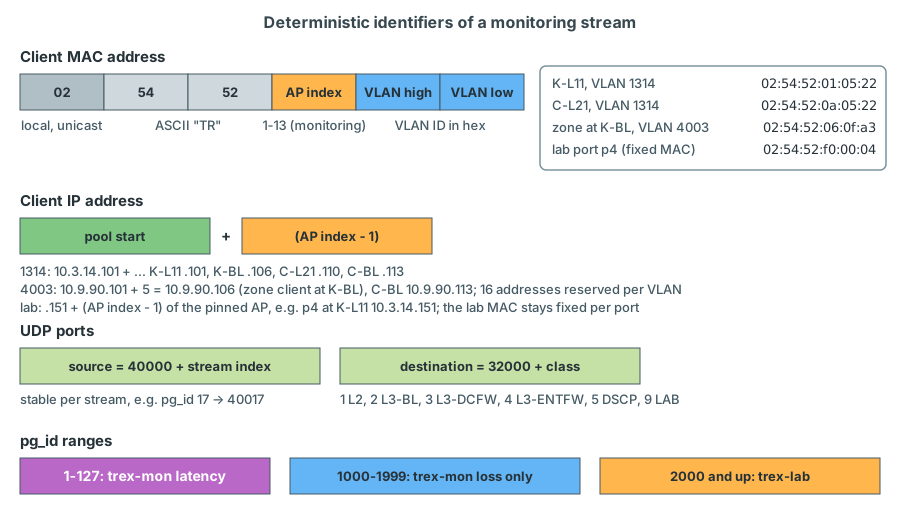
- MAC =
02:54:52:<AP index>:<VLAN high>:<VLAN low>for the monitoring (EMU) clients;02= locally administered unicast. The zone client at K-BL in VLAN 4003 (0x0FA3) is02:54:52:06:0f:a3. Lab clients are different: a lab port keeps one fixed MAC (src_macin the TRex configuration,02:54:52:f0:00:04for p4 ...:07for p7) whatever it is pinned to, because TRex answers ARP for a lab port with the port MAC and a lab port is re-pinned over time; the fixed MAC keeps the static MAC entries on the TX switch and the firewall objects stable. - IP = pool start + (AP index - 1); each monitored VLAN reserves 16 addresses (pools 10.3.14.101-116, 10.3.15.101-116, 10.9.90.101-116 and one pool per production VLAN from IPAM). The zone clients are therefore 10.9.90.106 (K-BL, index 6) and 10.9.90.113 (C-BL, index 13). The DHCP scopes of VLAN 1314/1315 (relay on Vsi914/915) must exclude the pools. A lab client's IP follows its pinned AP with the same rule in the lab pool: .151 + (AP index - 1), i.e. addresses .151-.166 of a VLAN (10.3.14.151 for p4 at K-L11 in VLAN 1314, 10.9.90.156 for the lab zone client on p6 at K-BL); every VLAN used for lab tests needs this second reservation in IPAM and a DHCP exclusion as well.
- UDP destination port = 32000 + class: 32001 L2, 32002 L3-BL, 32003 L3-DCFW, 32004 L3-ENTFW, 32005 DSCP, 32009 LAB. The firewall rules permit 32000-32099, so new streams need no new rule as long as they stay in the TRex pools.
- UDP source port = 40000 + stream index, stable per stream. Using the pg_id as the index (pg_id 17 gives source port 40017) is the simplest way to keep it unique and stable. A fixed source port means one firewall session per stream and spreads different streams over ECMP and LACP members.
- pg_id - 32-bit user IDs in the plan's fixed ranges: trex-mon latency streams 1-127, trex-mon loss-only streams
1000-1999, trex-lab streams from 2000 upwards. trexctl allocates them and persists the assignment in
/data/trexctl/state/pgid-map.json(next to the applied-profile and exporter state; include it in the nightly backup and copy it into the configuration repository when it changes): the key isclass|kind|src_ap|src_vlan|dst_ap|dst_vlan|tos, and a new stream gets the lowest free ID of its kind's range. A stream therefore keeps its pg_id for its whole life - Grafana history is keyed by it. - TTL 64 and TOS 0x00 (BE); the DSCP group uses 0x00, 0xB8, 0x88 and 0x20. TRex sets bit 0 of the TOS byte on every statistics packet itself, so on the wire these read 0x01, 0xB9, 0x89 and 0x21 - the DSCP is unchanged, the ECN field reads 01.
Why must pg_ids stay stable?
InfluxDB stores every measurement with the stream's tags - pg_id, class, source and destination AP and DC, VLANs, VRF, TOS, kind. If a re-apply - for example the one the exporter's supervisor thread runs automatically after a trex-mon restart - gave K-L11 to K-BL a new pg_id, Grafana would show the old series ending and a new one starting, alert rules would lose their history and a baseline would start from zero. The planned orchestrator therefore keeps the persistent map from stream key (class, kind, source AP, source VLAN, destination AP, destination VLAN, TOS) to pg_id described above.
The profile file (planned format)
The orchestrator trexctl does not exist yet; it is specified in the plan and has to be developed. Its profile format
(plan section 9.4) describes groups of pairs instead of individual streams: kind: latency | flowstat selects latency or
loss-only streams, and pairs_from lets a group re-use the pairs of other groups. The file below is the plan's default
profile monitoring-default, written with the class tag values that the dashboards and alerts use.
planned format - trexctl not yet developed
version: 1
name: monitoring-default
instance: mon
defaults:                             # (1)!
  kind: latency
  pps: 200
  size: 128
  tos: 0
  ttl: 64
  bidir: true
  dport_base: 32000
  sport_base: 40000
groups:
  - name: l2-intra-rzk
    class: L2
    vlans: [1314]                     # (2)!
    pairs: [[K-L11, K-BL], [K-L12, K-BL], [K-L21, K-BL], [K-L31, K-BL], [K-L41, K-BL]]
  - name: l2-intra-rzc
    class: L2
    vlans: [1314]
    pairs: [[C-L11, C-BL], [C-L12, C-BL], [C-L13, C-BL], [C-L21, C-BL], [C-L22, C-BL], [C-L23, C-BL]]
  - name: l2-inter-dc
    class: L2
    vlans: [1314]
    pairs: [[K-L11, C-L11], [K-L12, C-L12], [K-L21, C-L21], [K-L31, C-L22], [K-L41, C-L23], [K-BL, C-BL]]
  - name: l2-coverage-1315
    class: L2
    kind: flowstat                    # (3)!
    pps: 100
    vlans: [1315]
    pairs_from: [l2-intra-rzk, l2-intra-rzc, l2-inter-dc]   # (4)!
  - name: l2-coverage-prod
    class: L2
    kind: flowstat
    pps: 100
    vlans: [PROD-VLAN-A, PROD-VLAN-B] # (5)!
    pairs_from: [l2-intra-rzk, l2-intra-rzc, l2-inter-dc]
  - name: l3-bl
    class: L3-BL
    src_vlan: 1314                    # (6)!
    dst_vlan: 1315
    pairs: [[K-L11, K-L21], [K-L31, K-BL], [C-L21, C-L22], [C-L13, C-BL]]
  - name: l3-dcfw
    class: L3-DCFW
    src_vlan: PROD-VLAN-A
    dst_vlan: PROD-VLAN-B
    pps: 50
    pairs: [[K-L11, K-L41], [K-L21, K-L31], [C-L12, C-L23], [C-L11, C-L22]]
  - name: l3-entfw
    class: L3-ENTFW
    src_vlan: 1314
    dst_vlan: 4003                    # (7)!
    pps: 50
    pairs: [[K-L11, K-BL], [K-BL, K-BL], [C-L21, C-BL], [C-BL, C-BL]]
  - name: dscp-l2-interdc
    class: DSCP
    path: L2                          # (8)!
    vlans: [1314]
    pps: 100
    size: 256
    tos_set: [0x00, 0xB8, 0x88, 0x20]  # (9)!
    pairs: [[K-L11, C-L21]]
  - name: dscp-entfw
    class: DSCP
    path: L3-ENTFW
    src_vlan: 1314
    dst_vlan: 4003
    pps: 50
    size: 256
    tos_set: [0x00, 0xB8, 0x88, 0x20]
    pairs: [[K-L11, K-BL]]
tags: { environment: prod, owner: netzwerk }
- Defaults for every group: latency streams at 200 pps, 128 bytes, TOS 0, TTL 64, both directions; destination port =
dport_base+ class number, source port =sport_base+ stream index. vlans:means "same VLAN on both sides": the stream is Layer 2 and its destination MAC is the remote client's MAC. Each listed VLAN produces its own streams.kind: flowstatcreates loss-only streams (STLFlowStats); the defaultkind: latencycreatesSTLFlowLatencyStats.pairs_fromre-uses the pair lists of the three L2 latency groups: 5 + 6 + 6 = 17 pairs x 2 directions = 34 streams per listed VLAN.- Placeholders until LVR selects the production VLANs; the validator must reject a profile that still contains them.
src_vlan/dst_vlanmeans "routed": the destination MAC is the gateway MAC that EMU resolves for the source VLAN, and the destination is the client ofdst_vlanat the second AP of the pair.- VLAN 4003 is the zone VLAN of firewall-zone option B, the plan's default.
[K-L11, K-BL]means K-L11's VLAN-1314 client to the zone client at K-BL (10.9.90.106);[K-BL, K-BL]means K-BL's own VLAN-1314 client to the same zone client - same TRex port and S-VLAN, different C-VLAN. With option A,l3-entfwanddscp-entfwwould usedst_vlan: 1420and the APFWas the second element of every pair (Chapter 15). - The class tag of both DSCP groups is DSCP;
pathnames the forwarding the copies use - L2 or L3-ENTFW. Chapter 18 shows how this notation maps to the plan's profile schema. - One stream per TOS value and direction: 4 markings (BE reference 0x00, EF, AF41, CS1) x 2 directions = 8 streams. The values are the TOS bytes as built; on the wire TRex adds bit 0 (0x01, 0xB9, 0x89, 0x21).
Expanding the file gives exactly the tables above: the eight latency groups produce 10 + 12 + 12 + 8 + 8 + 8 + 8 + 8 = 74 streams, the two loss-only groups 34 (one VLAN) + 68 (two VLANs) = 102.
The same with native TRex
What trexctl will automate can be done today with the TRex Python API. The sketch builds one latency stream and one loss-only stream for the pair K-L11 to K-BL, double-tagged for a multiplexed port, and places each in its own dynamic profile on port 0 ("Dynamic multiple profiles", TREX-STL), so that one group can later be stopped or replaced without touching the others.
sketch - validate on the bench
from trex.stl.api import *
from scapy.layers.l2 import Ether, Dot1Q
from scapy.layers.inet import IP, UDP


def mon_stream(src_mac, dst_mac, svlan, cvlan, src_ip, dst_ip, dport, pg_id, kind, pps, size=128, tos=0):
    # latency streams: UDP checksum 0, because TRex writes the signature into every packet without fixing the checksum
    udp = UDP(sport=40000 + pg_id, dport=dport, chksum=0 if kind == 'latency' else None)
    pkt = (Ether(src=src_mac, dst=dst_mac) / Dot1Q(vlan=svlan) / Dot1Q(vlan=cvlan) /
           IP(src=src_ip, dst=dst_ip, tos=tos, ttl=64) / udp)
    pkt = pkt / ('x' * max(0, size - len(pkt)))                      # pad to 128 bytes (no FCS)
    stats = STLFlowLatencyStats(pg_id=pg_id) if kind == 'latency' else STLFlowStats(pg_id=pg_id)
    return STLStream(packet=STLPktBuilder(pkt=pkt), mode=STLTXCont(pps=pps), flow_stats=stats)


c = STLClient(server='127.0.0.1', sync_port=4501, async_port=4500)   # trex-mon
c.connect()
c.acquire(ports=[0])                                                 # bench only - see the warning below
c.set_port_attr(ports=[0], promiscuous=True)                         # receive frames for the client MACs
# the EMU clients of both ends must exist (chapter 6), so that their MACs are learned in the fabric

lat = mon_stream('02:54:52:01:05:22', '02:54:52:06:05:22', 3101, 1314,
                 '10.3.14.101', '10.3.14.106', 32001, pg_id=1, kind='latency', pps=200)
loss = mon_stream('02:54:52:01:05:23', '02:54:52:06:05:23', 3101, 1315,
                  '10.3.15.101', '10.3.15.106', 32001, pg_id=1001, kind='flowstat', pps=100)

c.add_streams([lat], ports='0.l2intra')                              # dynamic profile 'l2intra' on port 0
c.start(ports='0.l2intra')
c.add_streams([loss], ports='0.lossl2')
c.start(ports='0.lossl2')

active = c.get_active_pgids()                                        # {'latency': [...], 'flow_stats': [...]}
print(len(active['latency']), 'latency /', len(active['flow_stats']), 'flow-stat pg_ids in use')
In the console, profile IDs are addressed as <port>.<profile>: start -f <file.py> -p 0.l3bl,
stop -p 0.l3bl --remove, profiles and streams (TREX-STL "Dynamic multiple profiles"); stats -s and stats -l
show the per-stream and latency counters - but only for the first 4 (stats -s) or 5 (stats -l) pg_ids, so the whole
profile is only visible through the API, the exporter and Grafana. Keep profile IDs short and alphanumeric, like the
examples in the TRex guide.
Never take over the monitoring ports casually
TRex grants read-write control of a port to one client at a time; other clients can only read statistics (TREX-STL
"Control of TRex interfaces"). After trexctl apply the monitoring streams run on p0 and p1 without an owner:
apply ends with disconnect(stop_traffic=False, release_ports=True), so the streams keep running on the server, and
the next apply or update re-acquires the ports with force=True. Whoever acquires them in the meantime - a script or a
second console - owns the running traffic, and reset() force-acquires the ports, stops the traffic, removes all
streams and clears the statistics (TREX-API reset). On the production instance, read statistics with a connected but
non-acquiring client and end it with disconnect(stop_traffic=False) - the default disconnect() stops the traffic of
every port the client owns; make changes only through trexctl. The exporter's supervisor thread watches for a
trex-mon restart (server uptime reset, or active_streams falling to zero while a profile is recorded as active in
/data/trexctl/state/) and re-applies the active profile once the server accepts connections again.
Budget guard rails and why they exist
| Guard rail | Hard limit | Default profile | Why the margin |
|---|---|---|---|
| Latency streams per instance <= 120 | 128 | 74 | A profile update that adds before it removes, or an ad-hoc test, must not hit the hard limit half-way; 8 streams stay in reserve |
| Flow-statistics streams <= 600 | 1023 (--software) |
102 | Every flow-stat packet is processed by the software RX path; the margin keeps the RX core comfortable and leaves room for growth |
| Total rate <= 50 kpps | no fixed TRex number for the software path | 20.6 kpps | Headroom for temporary rate increases (convergence tests), for EMU traffic and for unexpected floods into the monitoring ports; negligible network load |
| <= 100 pps per stream through a firewall | none | 50 pps | Firewalls are shared production devices that process every packet of every session; 50 pps gives 20 ms resolution, which is enough for a firewall path |
At 128 bytes, 50 kpps correspond to about 51 Mbit/s of frame data - still a small fraction of a 10G port. The guard rails
belong in the orchestrator's validation (the plan's inventory already carries a budget block): a profile that exceeds
them is rejected unless someone deliberately forces it.
Changing the matrix safely
Any change follows the same five steps:
- Plan. What should be measured, which class, which pairs, latency or loss only? Recompute the totals: latency streams, flow-statistics streams, total pps, pps per firewall stream. Check the prerequisites outside TRex: IPAM pools, DHCP exclusions, the VLAN on the AP ports (Chapter 13), firewall rules (Chapter 15).
- Validate. With trexctl:
trexctl inventory validateandtrexctl plan -p <profile>list every stream with pg_id, ports, addresses, rate and the budget summary - no change is made (planned commands). With native TRex: let your script print the stream list and count the streams per kind before it adds anything. - Apply. At a quiet time, with a Grafana annotation. Replace only the changed group: with one dynamic profile per
group, the other groups keep running and keep their history. Add the EMU clients of a new AP or VLAN one by one
(
add_ns,add_clients); never reload the whole EMU profile while monitoring runs -load_profile(consoleemu_load_profile) first removes all clients and namespaces, so every emulated host would briefly disappear. - Verify. RX = TX for every new stream after a few seconds; EMU clients of routed streams resolved their gateway;
get_active_pgids()shows the expected counts; Grafana shows the new series and the existing series continue. - Record. Commit inventory and profile to git with the ticket number.
Worked examples
- A third production VLAN, loss only. One more entry in
vlans:ofl2-coverage-prod: +34 flow-statistics streams and +3 400 pps, 74 latency, 136 loss-only, 20 600 + 3 400 = 24 000 pps. Well within all guard rails. - Latency instead of loss for VLAN 1315.
l2-coverage-1315becomeskind: latencyat 200 pps: its 34 streams move from loss-only to latency, 74 + 34 = 108 latency streams (12 below the guard rail), 68 loss-only; 10 400 + 6 800 latency pps + 6 800 loss-only pps = 24 000 pps. Possible - but it consumes most of the remaining latency budget for a measurement that largely duplicates VLAN 1314. - Convergence test on the inter-DC pairs. The 12 latency streams of
l2-inter-dcgo from 200 to 1000 pps for a maintenance window (trexctl test convergence --group l2-inter-dc, planned): +12 x 800 = +9 600 pps, 30 200 pps in total. Because the multiplier does not apply to latency streams, the streams are removed and re-added with the new rate (their counters restart) and rebuilt again afterwards; annotate both moments. The loss-only streams of the inter-DC pairs cannot be raised on their own, because the coverage groups are split by VLAN, not by pair set - use the latency group or an ad-hoc profile.
Scaling options
- More loss measurements - plenty of room: 102 of 600.
- More latency measurements - first rebalance: are all latency streams still needed, could some become loss-only?
- A second monitoring instance with its own 128 latency streams on the reserve ports p2/p3 of NIC1. It needs its own
prefix, ZMQ ports, memory limit and cores; two instances would share one physical NIC; and the EMU server is a single
named helper per host - a second instance started with
--emurestarts it and wipes the clients of the first, so the EMU setup of a second instance is an open question. This must be validated on the bench before it is planned confirm on the bench.
Interaction with the firewalls
- One session per stream. Each stream has a fixed 5-tuple. The default profile creates 16 sessions on the Enterprise firewall (8 L3-ENTFW + 8 DSCP streams) and 8 on the DC firewall. Adding pairs adds sessions one by one.
- Timeouts. The default UDP session timeout of 40 s is never reached while a stream runs (a packet every 20 ms at 50 pps). After a stop of more than 40 s the sessions are created again by the first packets.
- Rules independent of the matrix. The rules permit UDP 32000-32099 between the TRex pool objects in both directions, so new pairs through the same firewall need no rule change as long as both ends are in existing pools.
- Load. The whole firewall share of the default profile is 800 pps through the ENT-FW (16 x 50 pps) and 400 pps through the DC-FW (8 x 50 pps).
- Firewall MAC after a failover. Streams whose destination MAC is a firewall MAC - both directions of L3-DCFW, the
reverse L3-ENTFW and DSCP streams from the zone clients - keep the old MAC after a failover if the cluster answers with
member MACs, as it did in February 2025. trexctl's gateway-MAC tracker polls the gateway MACs resolved by EMU
(
dgw.rmac) every 10 s and rebuilds those streams (same pg_ids, counters restart, eventgateway_mac_changed), unless a ClusterXL virtual MAC makes this unnecessary. How quickly the streams recover depends on how the cluster announces the new MAC - the plan's 15 s are still to be confirmed (Chapter 15).
Baseline and fibre offsets
Absolute latency values differ by design: an RZC-RZC stream contains two TX-fibre crossings, an RZK-RZC stream one, an RZK-RZK stream none; a routed stream between two RZC APs crosses the DCI twice, between an RZC and an RZK AP once; firewall streams depend on the active member. A single threshold per class would therefore be wrong for most streams.
The animation shows why: watch the RZC-RZC stream pass the TX-to-TX fibre twice while the RZK-RZC stream passes it once. The design consequences:
- Baseline per stream. After bring-up, let the profile run for a baseline period (the plan suggests seven days) and
derive thresholds from each stream's own behaviour (Chapter 19). The tag
dc_pair(rzk-rzk, rzk-rzc, rzc-rzc, and x-fw for the streams to or from the firewall zone) groups streams with comparable offsets. - Calibrate the fibre offset once. Compare the intra-RZK and intra-RZC L2 baselines: the difference is 2 x (one-way TX-fibre delay + one TX-switch transit). Document it next to the baseline instead of subtracting it from the data.
- Re-baseline after path changes. A new TX-fibre route, a moved DCI, a different active firewall member or a new firewall release changes the baseline - annotate and accept the new level deliberately.
Latency statistics: what TRex delivers and what the design must respect
For every latency stream, get_pgid_stats() returns these values (TREX-API get_pgid_stats):
| Field | Meaning | Design consequence |
|---|---|---|
average |
Low-pass filtered: each sampling period, average = previous average / 2 + average of the last period / 2 | Not the mean of your polling interval: with 0.5 s periods (the last_max window), the last 0.5 s carries half of the weight and the last 2 s about 94 % |
total_min, total_max |
Minimum and maximum over the stream's lifetime | Exact - if total_max grew since the last poll, the new value is the interval maximum |
last_max |
Maximum of the last 0.5 s window only | At a 2 s poll, 1.5 s of every interval are not represented - peaks are missed |
jitter |
Computed as in RFC 3550, appendix A.8 | A smoothed running estimate, not a per-interval value |
histogram |
Cumulative packet counts per logarithmic bucket; the key is the lower bound in µs (for example {100: 13}: 13 packets between 100 and 200 µs) | The difference of two polls is the latency distribution of the interval; its highest non-empty bucket bounds the interval maximum |
err_cntrs |
dropped (an estimate), dup, out_of_order, seq_too_high, seq_too_low - derived from the sequence numbers |
Duplicates and reordering are visible per stream, for example after a path change |
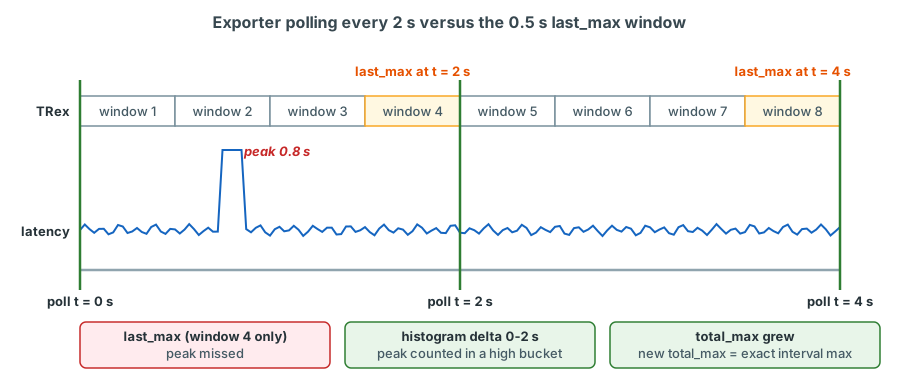
An exporter that polls every 2 s - the plan's default interval - must therefore derive the interval maximum from the
histogram delta, or poll every 0.5 s; reading only last_max misses peaks. The planned exporter writes the upper edge
of the highest bucket that grew in the interval as lat_max_us (bucket resolution: a 380 µs peak is written as 400 µs)
and keeps TRex's exact lifetime record separately as lat_total_max_us. It also stores TRex's last_max as
lat_last_max_us - for reference only, never as the interval maximum.
Packet counters for loss are cumulative (tx_pkts, rx_pkts per port and pg_id), so loss per interval is the difference
of the deltas, and an outage is lost packets / pps. Chapter 18 shows how the planned exporter
implements this.
Key takeaways
- TRex measures latency on at most 128 streams per instance, in addition to up to 1023 flow-statistics streams in software mode; double-tagged frames require software mode, in which every received packet is processed by the RX core.
- The default profile spends 74 latency streams on VLAN 1314 and the routed and DSCP classes (the DSCP group includes a
BE reference), and 102 loss-only streams on VLAN 1315 and two production VLANs (
l2-coverage-1315,l2-coverage-prod): 176 streams, 20 600 pps, 22.3 Mbit/s (26.3 Mbit/s on the wire). - Loss resolution is one packet interval: 5 ms at 200 pps (fabric), 10 ms at 100 pps (loss-only, DSCP L2), 20 ms at 50 pps (firewalls).
- Intra-DC pairs are stars around the BL AP, each RZK AP has one inter-DC partner, and a few selected pairs carry the routed, firewall and DSCP classes. The L3-ENTFW pairs end at the VLAN 4003 zone client at the BL AP of the source's data centre (10.9.90.106 at K-BL, 10.9.90.113 at C-BL).
- Addresses, ports and pg_ids are computed deterministically and must stay stable, because Grafana history and alert baselines are keyed by them; pg_ids come from fixed ranges (latency 1-127, loss-only 1000-1999, lab from 2000).
- Guard rails: <= 120 latency streams, <= 600 flow-statistics streams, <= 50 kpps, <= 100 pps per stream through a firewall. Changes follow plan - validate - apply - verify - record, one group at a time.
- Latency streams ignore the multiplier, so rate changes mean removing and re-adding them;
last_maxcovers only 0.5 s, so an exporter derives the interval maximum from histogram deltas (upper edge of the highest bucket that grew).
Check your understanding
1. Why can the platform not simply measure latency on all four VLANs under test?
Latency on every L2 pair of four VLANs plus the routed and DSCP classes would need 34 x 4 + 8 + 8 + 8 + 16 = 176 latency streams, but one TRex instance supports only 128. Latency is mainly a property of the path, which is the same for all VLANs between two APs, so one carrier VLAN gives the latency picture and loss-only streams per VLAN catch the VLAN-specific failures.
2. Recompute the total rate of the default profile and its frame data rate.
Latency streams: 4 400 (L2 intra) + 2 400 (L2 inter) + 1 600 (L3-BL) + 400 (L3-DCFW) + 400 (L3-ENTFW) + 800 + 400 (DSCP) = 10 400 pps. Loss-only: 102 x 100 = 10 200 pps. Total 20 600 pps. Frame data: 19 400 x 128 B + 1 200 x 256 B = 2 790 400 B/s = 22.3 Mbit/s; with 24 bytes of FCS, preamble and gap per frame (20 600 x 24 B = 4.0 Mbit/s) 26.3 Mbit/s.
3. A loss-only stream at 100 pps lost 23 packets. How long was the outage, and what would a latency stream at 200 pps have shown?
About 230 ms (23 / 100 pps), with 10 ms resolution. A 200 pps stream on the same path would have lost about 46 packets and given the outage with 5 ms resolution, plus latency, jitter and sequence-error counters around the event.
4. Someone wants to raise the 12 inter-DC latency streams to 1000 pps with the console command update -m. What happens?
Nothing for those streams: the global multiplier does not apply to latency streams (TREX-STL). Their rate is part of the stream definition, so they must be removed and re-added with 1000 pps (their counters restart) and rebuilt again afterwards. The budget allows it: +9 600 pps gives 30 200 pps, below the 50 kpps guard rail.
5. Why is the UDP source port of a stream fixed, and why is 40000 + pg_id a convenient choice?
A fixed source port keeps the 5-tuple constant: one firewall session per stream, one stable ECMP/LACP path per stream and therefore a meaningful baseline, while different streams spread over the parallel links. Deriving it from the stable, unique pg_id guarantees uniqueness and stability without a second allocation table.
6. The exporter polls every 2 s and stores only last_max. A latency spike of 900 µs lasting 100 ms occurred 1.2 s before a poll. Is it visible?
No. last_max covers only the last 0.5 s before the read-out, so the spike, 1.2 s earlier, is outside its window. It
would be visible in the histogram delta of that interval (packets in a high bucket) and, if 900 µs exceeded the
previous lifetime maximum, as an increase of total_max.
7. A new production VLAN exists only in RZC. How many loss-only streams does it add with the default pair matrix?
Only the intra-RZC star applies: 6 pairs x 2 directions = 12 streams (1 200 pps at 100 pps). The RZK star and the
inter-DC pairs need the VLAN in RZK, so they cannot be built. The VLAN can therefore not simply be added to
l2-coverage-prod, whose pair lists include RZK APs - class L2 requires the VLAN on both APs of every pair. It gets
its own loss-only group that re-uses only the pairs of l2-intra-rzc.
8. Why does the design keep 8 latency streams in reserve (guard rail 120) instead of allowing 128?
So that an ad-hoc latency test or a profile update that adds new streams before removing old ones never runs into the hard limit half-way, which would leave the profile partially applied. The guard rail is a planning limit; the hard limit is what TRex enforces.
References
- TRex stateless guide, https://trex-tgn.cisco.com/trex/doc/trex_stateless.html: "Tutorial: Per stream statistics"
(Table 14, QinQ with
--software, X710 without RX byte counters), "Tutorial: Per stream latency/jitter/packet errors" (limit 128, 16-byte payload, multiplier, 5 Mpps guidance), "Dynamic multiple profiles", "Control of TRex interfaces" (local copyartifacts/tmp/docs/trex_stateless.txt). - TRex manual, https://trex-tgn.cisco.com/trex/doc/trex_manual.html, command line option
--software. - TRex STL client API, https://trex-tgn.cisco.com/trex/doc/cp_stl_docs/api/client_code.html:
get_pgid_stats(fieldsaverage,last_max,total_max,histogram,jitter,err_cntrs; 1024 pg_ids per call),get_active_pgids,acquire,reset,add_streams,set_port_attr(local copyartifacts/tmp/docs/stl_client_api.txt). - trex-core source, https://raw.githubusercontent.com/cisco-system-traffic-generator/trex-core/master/src/trex_defs.h
(
MAX_FLOW_STATS 1023,MAX_FLOW_STATS_X710 127,MAX_FLOW_STATS_PAYLOAD 128). - RFC 3550, RTP: A Transport Protocol for Real-Time Applications, appendix A.8 (interarrival jitter).
- HPE FlexFabric 5950 Layer 2 - LAN Switching Configuration Guide R630x, PDF p. 377 (cut-through forwarding disabled by default).
- LVR running configuration
sw-rzk-BL(Vsi-interface914/915 with DHCP relay to 10.10.252.252 and 10.10.254.254). - Plan document v0.92 (14 October 2026), sections 4.5 (monitoring matrix and packet budget), 4.6.3 and 4.6.4
(deterministic addressing, lab client identity, UDP ports, pg_id ranges), 9.4 (profile
monitoring-defaultand its expansion rules), 9.5 (stream generation, pg_id allocation, gateway-MAC tracking, port release after apply) and 9.10 (exporter supervisor thread).