9. Grafana
In this chapter
You will learn
- what Grafana does and how
grafana-server, its database, plugins and data sources fit together - how users, teams, roles and the planned Active Directory login work
- how the InfluxDB data source with Flux is configured, and what
v.windowPeriodhas to do with the 2-second exporter interval - how dashboards and panels are built: queries, transformations, units, thresholds, overrides, legends, variables
- how to read time series correctly: mean versus max, gaps versus zeros, annotations
- how unified alerting works in depth: rules, expressions, pending period, No Data and Error handling, notification policies, mute timings and silences
- how data sources, dashboards and alert rules are provisioned from version-controlled files
Prerequisites: Chapter 8 (InfluxDB data model and Flux)
Grafana is the part of the platform that everybody sees. The network team watches its dashboards, receives its alert e-mails and uses its time picker to look back at last night's maintenance window. As the support person you have to do more than read it: you must be able to tell whether a strange curve is a network problem or a display artefact, why an alert did or did not fire, and how a dashboard gets back to its defined state after somebody changed it.
What Grafana is
Grafana is a web application for visualising and alerting on data that lives elsewhere. It stores no measurement data of its own: every panel sends a query to a data source (here InfluxDB) each time it is displayed or refreshed, and every alert rule queries the data source on its own schedule. What Grafana does store is the definition of things - dashboards, alert rules, users, permissions - plus alert state, silences and manually created annotations.
In the LVR platform
One Grafana instance runs on trex-rzk-01 next to InfluxDB. The planned version line is Grafana 12.4.x;
13.x is also acceptable (13.2.3 and 12.4.12 were released on 29 September 2026). Users reach it over HTTPS with
their Active Directory accounts; it reads InfluxDB through a read-only token; alert e-mails go to the network
team. Dashboards and alert rules are defined in files under version control, not clicked together by hand.
Architecture
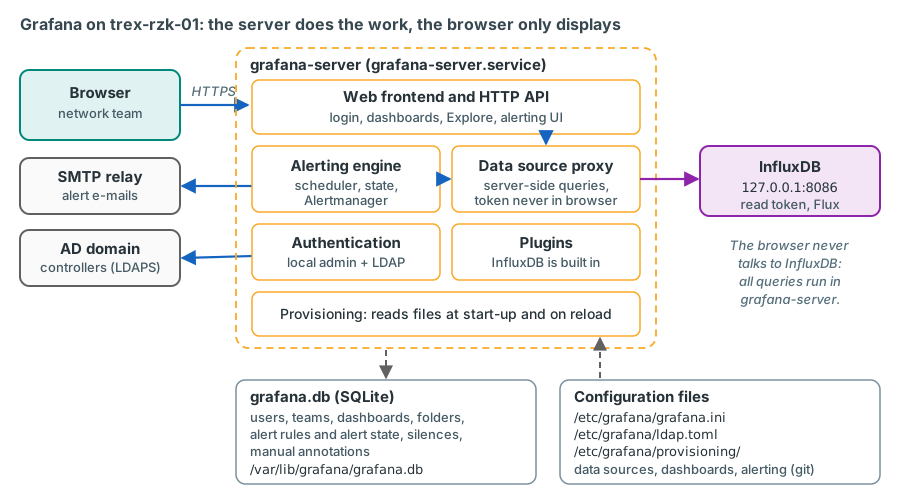
Everything runs in one process, started by the systemd unit grafana-server:
| Part | What it does |
|---|---|
| Web frontend and HTTP API | Serves the single-page application to the browser and the REST API that the frontend (and scripts) use |
| Data source proxy | Executes queries on the server: the browser asks Grafana, Grafana asks InfluxDB with the stored token, and returns the result. This is the "Server" (proxy) access mode |
| Alerting engine | Schedules and evaluates alert rules, keeps the state of every alert instance, and contains an Alertmanager that groups, silences and sends notifications |
| Provisioning | Reads data sources, dashboards and alerting resources from files at start-up (and on request) |
| Plugins | Data sources and panels; the InfluxDB data source is built in |
| Database | grafana.db, an embedded SQLite file in /var/lib/grafana: users, teams, dashboards, alert rules and state, silences, manual annotations |
Configuration lives in /etc/grafana/grafana.ini (RPM package), provisioning files under /etc/grafana/provisioning/,
and plugins in /var/lib/grafana/plugins.
Why the server-side proxy matters here
Because Grafana executes all queries itself, InfluxDB can stay bound to 127.0.0.1 and its token never leaves the
server. The same mechanism lets alert rules run with nobody logged in. The price is that every open dashboard
creates load on trex-rzk-01 - one reason for sensible refresh intervals and for long-term data in a separate
bucket.
Grafana's documentation recommends MySQL or PostgreSQL instead of SQLite for production. On this single server
with a handful of users, and with everything important defined in git, the embedded SQLite file is the pragmatic
choice - provided grafana.db is part of the nightly backup (it contains alert state, silences and users).
Users, organisations, teams and roles
- An organisation is an isolated tenant with its own dashboards, data sources and users. LVR uses the default organisation only.
- Users log in locally or through LDAP. A team groups users so that permissions can be given to the group.
- Every user has an organisation role: Viewer (view dashboards, query data sources), Editor (also create and change dashboards and folders), Admin (also manage users, teams, data sources), or No basic role. Folder and dashboard permissions can restrict access further.
- A Grafana server administrator manages server-wide settings and all organisations - for the platform administrators only.
Login with Active Directory
The plan is LDAP authentication against the LVR domain controllers: members of the network team's AD group become
Editors, other permitted users Viewers, and a local admin account remains as break-glass access (password in the
password safe). LDAP is enabled in grafana.ini verified (keys from Configure LDAP
authentication) and configured in ldap.toml:
[auth.ldap]
enabled = true
config_file = /etc/grafana/ldap.toml
allow_sign_up = true
[[servers]]
host = "<dc1.example> <dc2.example>"
port = 636
use_ssl = true
start_tls = false
ssl_skip_verify = false
root_ca_cert = "/etc/grafana/lvr-root-ca.pem"
bind_dn = "<DN of the Grafana service account>"
bind_password = '$__env{LDAP_BIND_PASSWORD}'
search_filter = "(sAMAccountName=%s)"
search_base_dns = ["<base DN of the user accounts>"]

[servers.attributes]
member_of = "memberOf"
email = "mail"

[[servers.group_mappings]]
group_dn = "<DN of the network team group>"
org_role = "Editor"

[[servers.group_mappings]]
group_dn = "<DN of the read-only group>"
org_role = "Viewer"
confirm with LVR keys taken from the Grafana LDAP documentation (several hosts may
be listed space-separated; allow_sign_up = true lets Grafana create users at their first LDAP login); domain
controllers, DNs and groups must come from the LVR directory team. The first matching group mapping wins, and roles are
re-synchronised at every login, with LDAP as the authoritative source. Changes to ldap.toml need a restart of
Grafana; [log] filters = ldap:debug helps when a login fails. Recent Grafana versions can also configure LDAP in the
UI (Administration > Authentication > LDAP).
Connecting InfluxDB
The data source tells Grafana where InfluxDB is and how to talk to it. For Flux, the relevant settings are:
| Setting | LVR value | Meaning |
|---|---|---|
| Query language | Flux | Selects Flux instead of InfluxQL or SQL |
| URL | http://127.0.0.1:8086 |
Local InfluxDB; plain HTTP never leaves the host |
| Organization | lvr |
Also available in queries as v.organization |
| Default Bucket | trex (or trex_longterm) |
Available as v.defaultBucket |
| Token | Grafana read token | Read-only on both buckets (chapter 8) |
| Min time interval | 2s |
Lower limit for the automatic interval - see below. Default 10s |
| Max series | 1000 (default) | A query that returns more series than this fails with an error |
In Flux queries Grafana replaces five macros before sending them: v.timeRangeStart and v.timeRangeStop (the
dashboard time range), v.windowPeriod (the automatic interval), v.defaultBucket and v.organization.
The data sources are provisioned from a file, so the installation is reproducible. The token is read from an
environment variable (provided to grafana-server, for example through a systemd drop-in with EnvironmentFile=)
instead of being written into a file that ends up in git:
apiVersion: 1
datasources:
  - name: InfluxDB-trex
    uid: influx-trex
    type: influxdb
    access: proxy
    url: http://127.0.0.1:8086
    isDefault: true
    editable: false
    jsonData:
      version: Flux
      organization: lvr
      defaultBucket: trex
      timeInterval: 2s
    secureJsonData:
      token: $GRAFANA_INFLUX_READ_TOKEN
  - name: InfluxDB-trex-longterm
    uid: influx-trex-lt
    type: influxdb
    access: proxy
    url: http://127.0.0.1:8086
    editable: false
    jsonData:
      version: Flux
      organization: lvr
      defaultBucket: trex_longterm
      timeInterval: 1m
    secureJsonData:
      token: $GRAFANA_INFLUX_READ_TOKEN
verified structure and keys from the Grafana InfluxDB provisioning example and the
provisioning reference (timeInterval sets the minimum interval; $VAR is replaced from the environment). A fixed
uid lets alert rules and dashboards refer to the data source reliably.
Dashboards and panels
A dashboard is a JSON document: a title, a uid, a list of panels with their position on a grid, variables,
annotation queries, a default time range and refresh. A panel combines one or more queries with a
visualisation. When you save a dashboard for export, Grafana 13 offers a "Classic" and a "V2 Resource" model;
Grafana's documentation says to choose Classic for dashboards that must also work in Grafana 12.4 or older.
Visualisations for latency and loss
| Visualisation | Good for at LVR |
|---|---|
| Time series | Latency, jitter, rates and drops over time; the default and the most important one |
| Stat | One big number with colour, for example "streams currently dropping" or the worst latency per class |
| Gauge, bar gauge | A value against its limits, for example TRex CPU, or lost packets per AP pair as horizontal bars |
| Table | Outage tables, the latency matrix (source AP x destination AP), stream lists with coloured cells |
| Heatmap | Latency distribution over time from the histogram buckets (pre-bucketed data, "Calculate from data: No") |
| State timeline | States over time, for example per stream "OK / loss / path down" as coloured bands |
| Status history | Periodic states as a grid of cells |
| Bar chart | Categories side by side, for example EF / AF41 / CS1 / BE latency of the same AP pair |
Queries, transformations and field configuration
The data flows through four stages, all set in the panel editor:
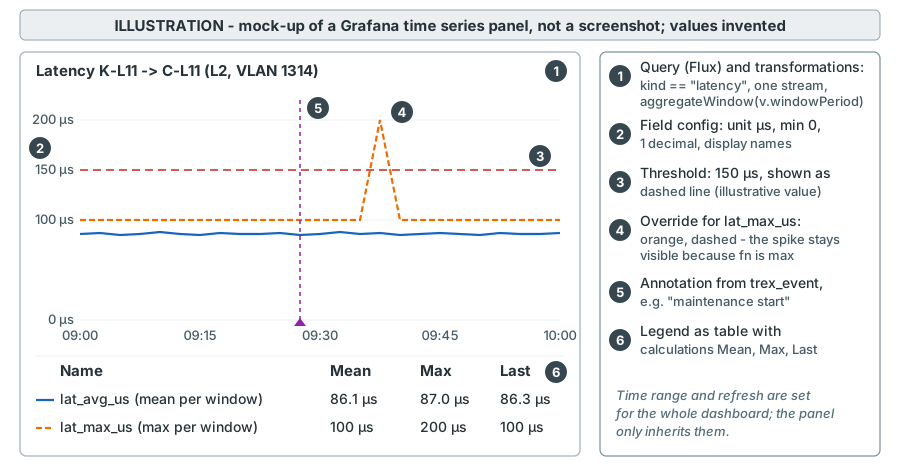
- Queries. Flux returns tables; Grafana turns them into data frames. Each table becomes a series whose name and labels come from its group-key columns.
- Transformations reshape frames inside Grafana: Join by field, Merge series/tables, Organize fields by name (rename, hide, reorder), Reduce (one value per series), Labels to fields, Grouping to matrix (rows x columns, ideal for an AP matrix), Sort by, Rename by regex, Filter data by values. Prefer doing the work in Flux when it is simple - the query result is then the same everywhere, including in Explore and alert rules.
- Field configuration - standard options for all fields: unit (
µsmicroseconds,ppspackets/sec,bpsbits/sec,percent), decimals, min and max, display name, colour scheme, No value (what to show for empty results); thresholds (absolute values or percentages, which colour the value or draw lines); value mappings (for example 0 -> "path down"). - Overrides change options for selected fields only: Fields with name, Fields with name matching regex,
Fields with type, Fields returned by query, Fields with values. Typical uses: draw
lat_max_usdashed in another colour, show RX rates as negative values (Graph styles > Transform > Negative Y) so that TX and RX of a port mirror each other.
The legend can be a list or a table with calculations (mean, max, last, ...). In a table legend, "Max" is the maximum of the values the query returned, not of the raw data - see Reading time series correctly.
Variables and repeating panels
Variables make one dashboard serve many questions. They appear as drop-downs at the top and are inserted into queries
as ${name}:
| Type | LVR example |
|---|---|
| Query | List of class, src_ap, dc_pair values read from InfluxDB tags |
| Custom | Fixed list, for example rzk-rzk,rzk-rzc,rzc-rzc,x-fw |
| Interval | Aggregation window 1m,5m,15m,1h (with an Auto option) |
| Text box, Constant, Data source | Free filter text; hidden constants; switch between InfluxDB-trex and InfluxDB-trex-longterm |
The query behind the src_ap variable validate on the bench:
import "influxdata/influxdb/schema"

schema.tagValues(
  bucket: v.defaultBucket,
  tag: "src_ap",
  predicate: (r) => r._measurement == "trex_stream" and r.kind == "latency" and r.class =~ /^${class:regex}$/,
  start: v.timeRangeStart,
)
- With Multi-value or Include All option, a variable can hold several values.
${class:regex}formats them as a regular expression such as(L2|L3-BL), so the filter uses=~with anchors. schema.tagValues()looks back 30 days by default; passingstart: v.timeRangeStartand setting the variable's Refresh to On time range change lists only values that exist in the selected time range.- Variables can be chained:
src_apabove depends onclass. - Repeating panels: in a panel's Repeat options choose Repeat by variable (a multi-value variable), direction and maximum per row - Grafana then draws one copy of the panel per selected value, for example one latency panel per source AP.
- Alert rules cannot use dashboard variables - they run without a dashboard context.
Time range, refresh and resolution
The time picker sets v.timeRangeStart/v.timeRangeStop for all panels; a panel can override it with Relative
time or Time shift. Refresh reloads all panels periodically. Grafana's min_refresh_interval (default 5 s)
limits how often; since the exporter writes every 2 seconds, refreshing faster than a few seconds shows nothing new and
only loads the server.
The resolution of a panel is decided by Grafana, not by the database:
- Max data points defaults to the panel's width in pixels.
- Grafana computes an interval of roughly time range / max data points, never below the Min interval (panel
setting or the data source's
timeInterval). In Flux it arrives asv.windowPeriod. - The query uses it:
aggregateWindow(every: v.windowPeriod, fn: ...).
With the exporter writing every 2 seconds:
| Time range | Panel ~1 200 px wide | Raw points per window | What you see |
|---|---|---|---|
| 15 minutes | interval below 1 s, raised to the 2 s minimum | 1 | Every single measurement |
| 6 hours | about 18 s | about 9 | Smoothed with mean, spikes kept with max |
| 7 days | several minutes | hundreds | Use trex_longterm (1-minute data) instead |
Without timeInterval: 2s a short time range would produce windows smaller than the write interval: most windows
would be empty and queries slower for no gain. Because the interval depends on the panel width, the same panel can
look different in the dashboard grid and in full-screen view; set Max data points or Min interval in the panel
when a computed value must not depend on the window size.
Reading time series correctly
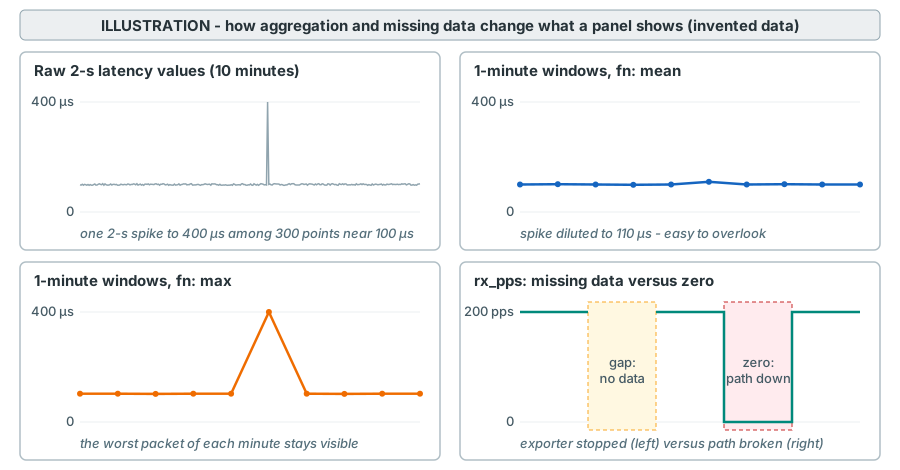
- Mean hides, max shows. A 2-second spike to 400 µs among thirty values of 100 µs becomes 110 µs in a 1-minute
mean. Latency panels therefore show
lat_avg_usaggregated withmeanandlat_max_usaggregated withmax. - Sums depend on the window. Lost packets aggregated with
sumperv.windowPeriodgive bars whose height grows when you zoom out. For "lost packets per minute" use a fixedevery: 1m. - Gaps are not zeros. With
createEmpty: falsea window without data produces no point. The time series panel's Connect null values (Never / Always / Threshold) and Disconnect values options decide whether a line is drawn across such gaps; for monitoring data, do not connect long gaps, or an exporter outage looks like a calm period. - Stat panels reduce too. A stat panel shows one value computed by its Calculation setting (last, mean, max, ...). "Last" of a latency series is the latest window, not the worst one.
- Time zone. Grafana shows the browser's time zone; InfluxDB stores UTC (chapter 8).
- Frozen latency. When a latency stream receives nothing, TRex keeps its last average; the exporter therefore
writes no latency fields for such intervals, and a dead path shows as a gap in the latency panels, not as a calm
line. Always read latency together with
rx_pps.
Annotations
Annotations mark events on time series and state timeline panels: a vertical line (or a shaded region) with a text.
- Manual annotations: Ctrl/Cmd + click on a panel adds one, Ctrl/Cmd + drag a region. They are stored in
grafana.db(built-in "Annotations & Alerts" query). - Annotation queries read events from a data source. For LVR, events written to
trex_event- for example bytrexctl annotate "Maintenance: sw-rzk-L21 IRF member 2 reboot", or thegateway_mac_changedevents that the gateway-MAC tracker of trexctl writes when it has rebuilt streams after a firewall failover - appear on every panel of a dashboard with this query validate on the bench:
from(bucket: "trex")
  |> range(start: v.timeRangeStart, stop: v.timeRangeStop)
  |> filter(fn: (r) => r._measurement == "trex_event")
  |> pivot(rowKey: ["_time"], columnKey: ["_field"], valueColumn: "_value")
The result has a _time column and a text column (text); in the annotation settings map text to Text and
kind to Tags. Until trexctl exists, a manual annotation in Grafana or a line written with influx write (for
example trex_event,kind=annotation text="...") does the same. The gateway_mac_changed events also feed the
informational alert rule "Gateway MAC changed" (Chapter 19).
Unified alerting
Grafana's alerting ("unified alerting") evaluates alert rules on the server and sends notifications through its built-in Alertmanager. The platform uses only Grafana-managed rules.
Alert rules: queries, expressions, condition
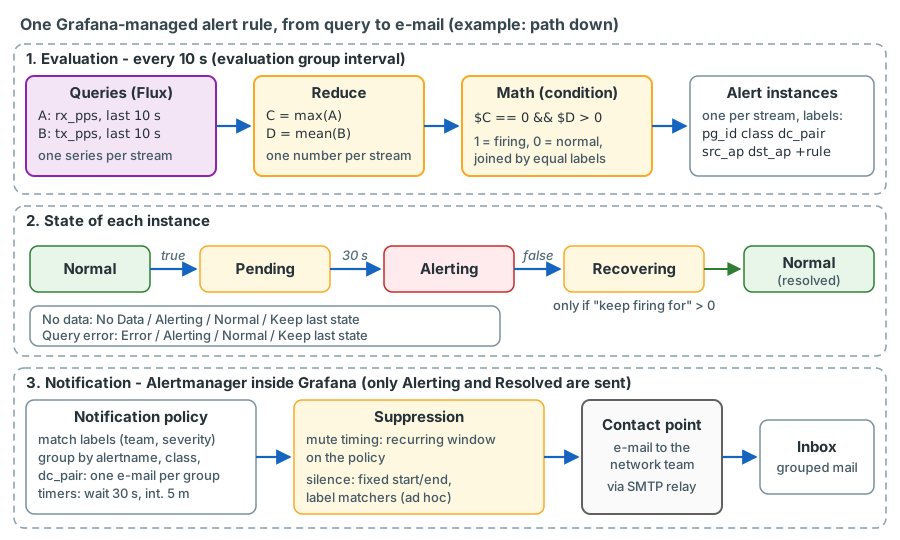
An alert rule contains one or more queries (here Flux against InfluxDB) and expressions that process them:
| Expression | What it does |
|---|---|
| Reduce | Turns each time series into one number: Min, Max, Mean, Median, Sum, Count, Last. Mode decides what happens with null/NaN values: Strict (result NaN), Drop non-numeric, Replace non-numeric |
| Math | Free formulas on series or numbers: $C * 2, $A > $B, $C == 0 && $D > 0. Relational and logical operators return 1 (true) or 0 (false) |
| Threshold | Compares a number with a limit: above, below, equal, within or outside a range; optional recovery threshold against flapping |
| Resample | Aligns time stamps of series before Math |
| SQL | MySQL-like processing of query results |
| Classic condition | Legacy, produces only one alert instance - avoid |
Exactly one query or expression is the condition; if it is 1 (or the threshold is breached), the rule fires for that series.
Multi-dimensional rules. A query that returns one series per stream produces one alert instance per stream.
Grafana turns the group-key tags of each Flux table into labels (_measurement and _field become the frame and
field names, not labels), and adds the labels of the rule. When a Math expression combines two queries, Grafana pairs
series whose labels are equal (or a subset of each other); a series without a partner is dropped with a warning. For
LVR this means: all queries of a rule must return the same tag columns - using keep(columns: [...]) with the same
list in every query makes this explicit.
Evaluation, pending period, states
- Every rule belongs to an evaluation group with an evaluation interval (for example 10 s); all rules of a group are evaluated at that interval.
- The pending period is how long the condition must hold before the instance goes from Pending to Alerting. With an interval of 30 s and a pending period of 90 s, the alert fires at the fourth consecutive breached evaluation. Pending period 0 fires at once.
- Keep firing for keeps an instance in Recovering for a while after the condition clears, so that a flapping value does not cause fire/resolve/fire mail storms.
- States: Normal, Pending, Alerting, Recovering, No Data, Error. Notifications are sent for transitions to Alerting and for resolution (back to Normal).
- Labels route and group alerts (for example
team=trex,severity=critical); annotations (summary, description, runbook URL) carry text into the notification.
No Data and Error - decisive for "path down"
Two special situations need an explicit decision per rule:
- No Data: the query ran but returned no data at all. Options: No Data (default - a separate alert
DatasourceNoDatais created), Alerting, Normal, Keep last state. - Error: the query failed or timed out (default timeout 30 s, 3 attempts). Options: Error (default - a separate
alert
DatasourceError), Alerting, Normal, Keep last state. - Missing series: if only some series disappear while others still return data, the missing instances keep
their state for two evaluations, then resolve as
Normal (MissingSeries)and are removed.
DatasourceNoData and DatasourceError alerts carry different labels (alertname, datasource_uid, rulename)
than the original instances, so silences and policies written for the original labels may not catch them.
In the LVR platform
A broken path does not produce No Data: the exporter keeps writing rx_pps = 0 and drop_pkts > 0, so the
path-down rule sees real zeros and fires normally. No Data means that nothing was written at all - the exporter,
the TRex instance or InfluxDB has a problem. The platform therefore sets No Data to Normal on the per-stream
rules (otherwise every rule would raise its own DatasourceNoData alert) and has one dedicated rule,
"TRex instance / exporter down", whose No Data state is Alerting. Chapter 19
lists every rule with these settings.
Contact points, notification policies, mute timings, silences
- A contact point says how to notify. LVR uses Email to the network team's distribution list
(optionally "single email" to all addresses at once). Email requires the
[smtp]section ingrafana.ini(enabled = true,host,from_address, credentials if needed). - Notification policies form a tree. The default policy at the root catches everything; child policies match
labels with
=,!=,=~,!~; the deepest matching policy handles the alert. Each policy groups alerts (default:alertnameandgrafana_folder) - one notification per group - and has three timers: group wait (default 30 s, collect related alerts before the first notification), group interval (5 m, before sending changes of a group) and repeat interval (4 h, before repeating an unchanged group). - Mute timings are recurring time intervals (weekdays, times, days of month, months, years, with a location - without one, times are UTC) attached to a policy: matching notifications are suppressed during the interval. They are created under Alerts & IRM > Alerting > Notification configuration > Time intervals.
- Silences have a fixed start and end and select alerts by label matchers - right for an ad-hoc maintenance
window ("silence
src_ap=K-L21from 22:00 to 23:30"). - Neither stops evaluation: alerts still change state and remain visible; only notifications are suppressed.
Provisioning from files
Provisioning makes the Grafana configuration reproducible and reviewable: the files live in git, a change is a commit, and a rebuilt server comes up identical.
| Directory | Content |
|---|---|
/etc/grafana/provisioning/datasources/ |
Data source definitions (above) |
/etc/grafana/provisioning/dashboards/ |
Providers that point to directories of dashboard JSON files |
/etc/grafana/provisioning/alerting/ |
Alert rule groups, contact points, the notification policy tree, mute timings, templates |
The dashboard provider for the TRex folder verified (keys from Provision Grafana, "Dashboards"):
apiVersion: 1
providers:
  - name: trex
    folder: TRex
    type: file
    disableDeletion: true
    allowUiUpdates: false
    updateIntervalSeconds: 30
    options:
      path: /opt/trexctl/dashboards
      foldersFromFilesStructure: false
allowUiUpdates: falseprevents saving a provisioned dashboard in the UI ("Cannot save provisioned dashboard"): changes must go through the file and git. Withtrue, UI changes would be overwritten by the next file change.- Grafana re-reads the dashboard directory (polling when
updateIntervalSecondsis above 10). Data sources and alerting files are read at start-up, or reloaded with the admin API (POST /api/admin/provisioning/datasources/reload,.../dashboards/reload,.../alerting/reload). - Alert rules provisioned from files are not editable in the UI. The practical workflow: build or change a rule in the UI of a test instance, export it (Grafana offers YAML export for rules, contact points, policies and mute timings), commit the file, deploy.
- The notification policy tree is a single resource: provisioning it replaces the whole tree. Keep all policies in one file.
- Values such as tokens or e-mail addresses can come from environment variables (
$VARor${VAR}). Not interpolated: the alert rule query model, rule annotations and mute timing contents.
Security basics
- HTTPS only:
[server] protocol = httpswith a certificate from the LVR PKI (cert_file,cert_key),min_tls_versionTLS1.2 or TLS1.3, and[security] cookie_secure = true. - No anonymous access:
[auth.anonymous]stays disabled (it is off unless explicitly enabled);[users] allow_sign_up = falseso nobody can register. - Least privilege: most users Viewer, the network team Editor, Admin and server administrator only for platform administrators; provisioned dashboards cannot be changed in the UI anyway.
- Secrets: InfluxDB read token and LDAP bind password from the environment, not from git; the local
adminpassword in the password safe. - Backups:
grafana.dbnightly with the server backup (users, alert state, silences, manual annotations); dashboards, rules and data sources are in git.
Key takeaways
- Grafana stores definitions and alert state, not measurements; every panel and every alert rule queries InfluxDB through the server-side data source proxy.
- Roles: Viewer, Editor, Admin per organisation; LDAP group mappings assign them at each login; a local admin remains for emergencies.
- Set the data source's minimum interval to the exporter interval (2 s);
v.windowPeriodis roughly time range divided by panel width, never below it. - Choose the aggregation by meaning:
meanfor typical latency,maxfor the worst packet,sumfor lost packets; a gap means "no data", zero means "measured zero". - Variables (query, custom, interval) make dashboards reusable; alert rules cannot use them.
- An alert rule is queries + expressions + one condition; one instance per series; pending period and keep firing for control timing; No Data and Error need an explicit decision per rule.
- Notification policies route by labels and group alerts; mute timings are recurring, silences are one-off; neither stops evaluation.
- Data sources, dashboards and alert rules are provisioned from files in git; the notification policy tree is one resource.
Check your understanding
1. A colleague wants to open InfluxDB's port 8086 to the office network so that Grafana in the browser can query it directly. Why is that unnecessary?
With the data source in "Server" (proxy) access mode, the browser never talks to InfluxDB: grafana-server executes every query with its stored token and returns only the result. InfluxDB can therefore stay bound to 127.0.0.1, and the token never reaches a browser. Opening the port would only add attack surface.
2. On a 7-day view the latency panel looks perfectly flat, but the alert history shows a latency alert on Tuesday. Is the panel wrong?
Probably not. Over 7 days each plotted point aggregates many raw values; if the panel shows lat_avg_us with
mean, short spikes disappear. Look at lat_max_us aggregated with max, zoom into Tuesday, or use the 1-minute
maxima in trex_longterm.
3. Why is the No Data state of the per-stream path-down rule set to Normal - would that not hide a total failure?
A broken path produces real zeros, not "no data", so path-down still fires. No Data only occurs when nothing was
written at all - exporter, TRex instance or InfluxDB down. Instead of letting dozens of rules raise their own
DatasourceNoData alerts, one dedicated "TRex instance / exporter down" rule has No Data set to Alerting and
reports the real cause once.
4. During a planned reboot of sw-rzk-L21 you do not want e-mails for streams of AP K-L21. Mute timing or silence?
A silence: the window is one-off with a fixed start and end, and you can match exactly the affected alerts by
label (for example src_ap=K-L21 and a second silence for dst_ap=K-L21). Mute timings are for recurring windows
and apply to whole notification policies. In both cases evaluation continues and the alerts stay visible.
5. Somebody edited a provisioned dashboard in the UI and now cannot save it. What is the right way to make the change?
The provider has allowUiUpdates: false, so provisioned dashboards can only be changed through their files.
Export the changed dashboard JSON (Classic model if 12.4 compatibility is needed), replace the file in the git
repository, commit with the ticket number, and deploy; Grafana picks up the changed file.
6. After new streams were added, the preview of the latency degradation rule warns that items were dropped from a union. What does that mean?
The rule's Math expression compares the current latency (query A) with a per-stream baseline (query B) and pairs series by their labels. The new streams have no baseline yet, so their series in A have no partner in B and are dropped: they are silently not checked for latency degradation. Either compute a baseline for them once enough data exists, or give new streams a provisional class threshold until then.
7. A panel shows 'Lost packets' as bars per v.windowPeriod. Why do the bars become higher when you zoom out?
When you zoom out, v.windowPeriod grows, and sum adds up more 2-second intervals per bar. The total stays the
same but is spread over fewer, higher bars. Use a fixed window (every: 1m) and a title like "lost packets per
minute" when the height must mean the same thing at every zoom level.
References
- Grafana documentation, https://grafana.com/docs/grafana/latest/ - Configure the InfluxDB data source (settings, Min time interval, Max series, provisioning examples), InfluxDB query editor (Flux macros), InfluxDB template variables, InfluxDB annotations, InfluxDB alerting.
- Grafana Provision Grafana (data sources incl.
timeIntervalanduid, dashboard providers, environment variables), Use configuration files to provision alerting resources, HTTP API - Admin (reload provisioning). - Grafana Visualizations, Time series (Connect null values, Disconnect values, Transform Negative Y), Heatmap (Calculate from data, Tick alignment), State timeline, Transform data (list of transformations), Configure standard options (No value), Configure thresholds, Configure field overrides, Configure panel options (repeating panels), Query options (Max data points, Min interval, Interval).
- Grafana Add variables, Variable syntax (
regexformat); Annotate visualizations. - Grafana alerting: Queries and conditions, Expression queries (Reduce modes, Math operators), Alert rule evaluation (pending period, keep firing for, states), No Data and Error states, Stale alert instances, Handle missing data, Dynamic thresholds, Notification policies, Group alert notifications (defaults), Configure email, Mute timings and active time intervals, Configure silences.
- Grafana Roles and permissions; Configure LDAP authentication; Anonymous authentication;
Configure Grafana (
[smtp],min_refresh_interval,cookie_secure,allow_sign_up,[database]SQLite note,min_tls_version); Back up Grafana (/var/lib/grafana/grafana.db). - Grafana source,
packages/grafana-data/src/valueFormats/categories.ts(unit IDsµs,pps,bps) and, for release v12.0.0,pkg/tsdb/influxdb/flux/builder.go(how Flux tables become frames and labels). - Grafana releases on GitHub: v13.2.3 and v12.4.12 (29 September 2026).
- Plan document v0.92 (14 October 2026), sections 10.3 (Grafana installation, data sources, authentication) and 10.5 (alert rules).