22. Scenarios - tests
In this chapter
You will learn
- to run every test with the same seven steps: define, pre-checks, annotate, execute, observe, post-checks, report
- to measure Layer 2 and Layer 3 paths with the monitoring instance (higher resolution) and with the lab instance (line rate on pinned ports), including the learning traffic that must come first
- to drive tests through the DC firewall and the Enterprise firewall, stateless and stateful (ASTF), together with the firewall team
- to verify DSCP marking end to end with a TRex capture and to read the TOS byte correctly
- to run an RFC 2544-style search for the no-drop rate, to calculate line rates for 64-1518 bytes and IMIX, and to recognise which limit you have actually measured
- to plan and supervise a soak test, including the effects of MAC and ARP ageing
Prerequisites: Chapter 4, Chapter 5, Chapter 7, Chapter 12, Chapter 14, Chapter 15, Chapter 16. Read Chapter 24 before you run any test in production.
The permanent monitoring of Chapter 21 answers the question "is the network healthy right now?". Tests answer different questions: "how much can this path carry?", "what does the firewall do to EF traffic?", "does this path stay clean for eight hours at 5 Gbit/s?". Tests are short, deliberate and much louder than monitoring - a single lab port can put 10 Gbit/s into a production VLAN. Each test is therefore taught as a complete scenario: what you set and why, what happens on the wire, the commands, what you should see, cleanup and risks.
trexctl, the planned orchestrator, does not exist yet. Every scenario therefore shows the native method that works on day one (TRex console, Python API, Comware CLI, Grafana UI) and then the planned trexctl command, labelled as planned.
Conventions for all tests
Which instance, which console
| Question | trex-mon (monitoring) | trex-lab (tests) |
|---|---|---|
| Console | ./trex-console -p 4501 --async_port 4500 -r (read-only) |
./trex-console -p 4601 --async_port 4600 |
| Ports | p0-p3, double-tagged, software mode, EMU | p4-p7, pinned, single-tagged, hardware mode or ASTF |
| Used for | ad-hoc higher-resolution streams within the budget | line rate, soak, firewall load, ASTF |
| Never | stop without a profile ID, stop -a, reset, --force, disconnect (stops the traffic of the owned ports - leave with quit), emu_load_profile, the bundled ./ndr tool |
ports p0-p3 (they belong to the other instance) |
Start every session by confirming where you are: stats -g prints the connection line with the RPC port (4501 is
trex-mon, 4601 is trex-lab). The console prompt also shows the service state of the acquired ports, for example
trex(service)> in service mode. clear is harmless on both instances: it only moves the reference point of your own
session; the exporter and other clients keep their counters.
Lab port numbers inside the lab console
Each TRex instance numbers its own interfaces from 0, in the order of the interfaces list of its configuration
file (TRex manual, "Platform YAML": the order of the list matters, the first interface becomes port 0). The
server-level names p4-p7 are therefore ports 0-3 in the trex-lab console and API. --port 4 does not exist
there. The ASTF unit trex-lab-astf has its own two-port configuration: there p4 is port 0 and p6 is port 1 (T4).
| Server port | trex-lab port | sw-rzk-TX1 port | Default pin | S-VLAN |
|---|---|---|---|---|
| p4 | 0 | Ten-GigabitEthernet1/1/9 | K-L11 | 3101 |
| p5 | 1 | Ten-GigabitEthernet1/1/10 | K-L41 | 3105 |
| p6 | 2 | Ten-GigabitEthernet1/1/11 | FWZ (= K-BL, VLAN 4003) | 3110 |
| p7 | 3 | Ten-GigabitEthernet1/1/12 | C-L21 | 3204 |
FWZ is the inventory alias of AP K-BL with the zone VLAN 4003 (firewall-zone option B, the plan's default). p6 is
therefore a QinQ access port in S-VLAN 3110, and the C-VLAN is whatever TRex puts on its frames: the zone VLAN 4003 for
the firewall tests, or 1314/1315 when a test needs the Border Leaf side of VPN-CORE (T2) - AP K-BL carries all of
them. With firewall-zone option A, p6 would be pinned to AP FW instead (S-VLAN 3300, zone VLAN 1420); that S-VLAN is
already defined on both TX switches and its firewall ports Ten-GigabitEthernet1/1/7 (sw-rzk-TX1) and
Ten-GigabitEthernet1/1/8 (sw-rzc-TX1) are configured but shut down until option A is chosen.
Re-pinning a lab port is one command on sw-rzk-TX1 (port access vlan <S-VLAN> on the lab port, see
Chapter 12) plus the static MAC entries of Chapter 24.
Lab client addresses
A lab port keeps one fixed MAC whatever it is pinned to: 02:54:52:f0:00:04 for p4 up to 02:54:52:f0:00:07 for
p7, set as src_mac in the port_info of /etc/trex/trex_lab.yaml and recorded as mac: in the inventory
ports.lab. Only the lab IP follows the pinned AP: lab pool start .151 + (AP index - 1), i.e. the monitoring
address of that AP plus 50.
| Lab port | Fixed MAC (Comware notation) | Default pin (AP index) | VLAN 1314 | VLAN 1315 |
|---|---|---|---|---|
| p4 | 02:54:52:f0:00:04 (0254-52f0-0004) |
K-L11 (1) | 10.3.14.151 | 10.3.15.151 |
| p5 | 02:54:52:f0:00:05 (0254-52f0-0005) |
K-L41 (5) | 10.3.14.155 | 10.3.15.155 |
| p6 | 02:54:52:f0:00:06 (0254-52f0-0006) |
FWZ = K-BL (6) | 10.3.14.156 | 10.3.15.156; zone VLAN 4003: 10.9.90.156 |
| p7 | 02:54:52:f0:00:07 (0254-52f0-0007) |
C-L21 (10) | 10.3.14.160 | 10.3.15.160 |
Why the MAC is fixed per port while the IP follows the AP
TRex answers ARP for a lab port, and runs ASTF, with the port MAC (service and L3 mode, T2), and a lab port is
re-pinned to other APs over time. A MAC derived from the AP would have to change on every re-pin and with every VLAN;
a fixed MAC per port keeps the static MAC entries on the TX switch (Chapter 24) and the
firewall objects stable - only the S-VLAN of the entries and the lab IP move with the pin. The monitoring clients
(EMU) keep the per-AP formula 02:54:52:<index>:<VLAN hex>, because each of them belongs to exactly one AP.
These lab addresses lie outside the 16-address monitoring pools (10.3.14.101-116, 10.3.15.101-116). Every VLAN used
for lab tests therefore needs a second reservation, .151-.166, in IPAM and a DHCP exclusion - a prerequisite of the
first lab test, exactly like the pools (see Chapter 24). The firewall-zone lab client
follows the same IP rule: p6 is pinned to FWZ, i.e. AP K-BL (index 6) in the zone VLAN 4003, so T4 uses 10.9.90.156
as the ASTF server-side address. With firewall-zone option A it would be the lab client of AP FW (index 14):
10.9.90.164 in VLAN 1420, still with p6's MAC 02:54:52:f0:00:06. The zone subnet 10.9.90.0/24 itself still needs
IPAM approval (Chapter 15).
Lab streams use UDP destination port 32009 (class LAB; 32005 for DSCP tests), source ports from 40001 upwards and pg_ids
from 2001 upwards. In Layer 2 tests the stream carries the fixed MACs of the table explicitly; in Layer 3 mode the lab
port sends with its port MAC (explained in T2) - which, thanks to src_mac, is the same fixed MAC.
The generic test procedure
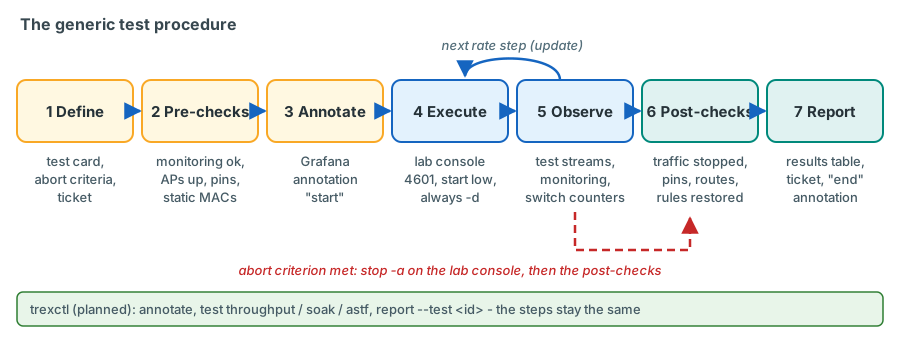
1. Define. Write a short test card before you touch anything: ID, purpose, class, APs and VLANs, instance and ports, rate plan (start rate, steps, maximum), duration, expected result, abort criteria, people involved and approvals. A test that touches production VLANs, a firewall or the DCI needs a ticket (rules in Chapter 24).
2. Pre-checks. The monitoring is healthy (planned dashboard "TRex - Overview" without path-down streams, or the
read-only status script of Chapter 20). The AP links of the test are up (display interface brief on the TX
switch). Static MAC entries for the lab clients are in place. Firewall rules and routes exist. No maintenance is
running on the devices in the path (change calendar). If you started a lab unit for the test, the host protection is
active again - every TRex start stops firewalld (Chapter 24).
3. Annotate. Mark the start in Grafana so that every dashboard shows the test. Native: press Ctrl (Cmd on macOS) and click on a time series panel of a saved dashboard, then enter the text and tags; or use the Grafana HTTP API:
confirm on device Grafana HTTP API "Annotations" (POST /api/annotations); URL and
token as installed
curl -s -X POST https://trex-rzk-01/api/annotations \
  -H "Authorization: Bearer $GRAFANA_TOKEN" -H "Content-Type: application/json" \
  -d "{\"time\": $(date +%s%3N), \"tags\": [\"test\", \"T1-0042\"], \"text\": \"TEST T1-0042 start: K-L11 <-> C-L21 VLAN 1314\"}"
Without dashboardUID Grafana creates an organisation-wide annotation; time is in milliseconds. Planned:
trexctl annotate "TEST T1-0042: ... start".
4. Execute. Start low and always with a duration (-d in the console, duration= in Python), so that a forgotten
test stops by itself. Increase the rate in steps (update).
5. Observe. Watch the test itself (tui, stats -s, stats -l in the lab console), the side effects on the
monitoring (Grafana) and the switch counters (display counters rate inbound interface on the TX switch and the AP
ports). Stop immediately when an abort criterion is met.
6. Post-checks. Lab traffic is really stopped (stats -g shows no TX), the monitoring is back to its baseline,
temporary pins, static routes, firewall rules and sessions are removed or restored as agreed.
7. Report. Results table, deviations, screenshots, annotation for the end. Attach to the ticket. Planned:
trexctl report --test <id> --format md.
A raw lab profile you can trust
Every native scenario below uses the same small profile. It is the profile udp_vlan_latency.py from the platform
plan, rewritten for the current TRex profile interface (argparse tunables, as in the TRex example
stl/flow_stats_latency.py) and extended by an optional load stream and a few safety checks.
sketch - validate on the bench
# UDP test stream with latency statistics (always) and an optional load stream.
# Single-tagged by default (pinned lab ports); --svlan adds the outer tag (trex-mon ports).
import argparse
import os

from trex.stl.api import *                      # STLStream, STLPktBuilder, STLTXCont, STLFlowStats, ...
from scapy.layers.l2 import Ether, Dot1Q
from scapy.layers.inet import IP, UDP

SIG_LEN = 16                                     # latency signature at the end of the payload


class UdpVlanLatency(object):

    def _builder(self, a, size, min_pad, vm=None):
        eth = Ether()
        if a.smac:                               # (1)!
            eth.src = a.smac
        if a.dmac:
            eth.dst = a.dmac
        pkt = eth
        if a.svlan:                              # outer tag only on multiplexed (double-tagged) ports
            pkt = pkt / Dot1Q(vlan=a.svlan)
        pkt = pkt / Dot1Q(vlan=a.cvlan)
        pkt = pkt / IP(src=a.sip, dst=a.dip, tos=a.tos, ttl=64)
        pkt = pkt / UDP(sport=a.sport, dport=a.dport, chksum=0)     # (2)!
        pad = size - len(pkt)                    # size = frame length without FCS
        if pad < min_pad:
            raise ValueError('frame size %d too small, need at least %d' % (size, len(pkt) + min_pad))
        return STLPktBuilder(pkt=pkt / (b'\x00' * pad), vm=vm)

    def get_streams(self, port_id=0, tunables=(), **kwargs):
        p = argparse.ArgumentParser(description=os.path.basename(__file__),
                                    formatter_class=argparse.ArgumentDefaultsHelpFormatter)
        p.add_argument('--svlan', type=int, default=0, help='outer tag, 0 = single-tagged')
        p.add_argument('--cvlan', type=int, default=1314, help='production VLAN (inner tag)')
        p.add_argument('--smac', default='', help='empty = port MAC (L3 mode)')
        p.add_argument('--dmac', default='', help='empty = port destination (resolved gateway)')
        p.add_argument('--sip', default='10.3.14.151')
        p.add_argument('--dip', default='10.3.14.160')
        p.add_argument('--tos', type=lambda x: int(x, 0), default=0)
        p.add_argument('--sport', type=int, default=40001)
        p.add_argument('--dport', type=int, default=32009)
        p.add_argument('--size', type=int, default=128, help='latency frame, bytes without FCS')
        p.add_argument('--pps', type=int, default=1000, help='latency rate, not scaled by -m')
        p.add_argument('--pg', type=int, default=2001, help='pg_id of the latency stream')
        p.add_argument('--load_pg', type=int, default=0, help='pg_id of the load stream, 0 = none')
        p.add_argument('--load_size', type=int, default=1514, help='load frame, bytes without FCS')
        p.add_argument('--flows', type=int, default=1, help='UDP source ports used by the load stream')
        a = p.parse_args(list(tunables))

        streams = [STLStream(name='lat-%d' % a.pg,
                             packet=self._builder(a, a.size, SIG_LEN),
                             mode=STLTXCont(pps=a.pps),
                             flow_stats=STLFlowLatencyStats(pg_id=a.pg))]
        if a.load_pg:
            vm = None
            if a.flows > 1:                      # (3)!
                vm = STLScVmRaw([STLVmFlowVar(name='sp', min_value=a.sport, max_value=a.sport + a.flows - 1,
                                              size=2, op='inc'),
                                 STLVmWrFlowVar(fv_name='sp', pkt_offset='UDP.sport')])
            streams.append(STLStream(name='load-%d' % a.load_pg,
                                     packet=self._builder(a, a.load_size, 0, vm),
                                     mode=STLTXCont(),                  # (4)!
                                     flow_stats=STLFlowStats(pg_id=a.load_pg)))
        return streams


def register():
    return UdpVlanLatency()
- Explicit MACs are for Layer 2 tests. Leave them empty in Layer 3 mode: TRex then uses the port MAC as source and the resolved gateway MAC as destination (a packet with default Ethernet addresses takes the port's addresses).
- For latency streams the TX core writes a new 16-byte signature (sequence number, timestamp) into every packet after the template was built and does not recalculate the UDP checksum, so a precomputed checksum would be wrong in every packet. Checksum 0 means "not computed" in IPv4, so devices that verify UDP checksums (firewalls, hosts) have nothing to reject. confirm on the bench how the firewalls treat it. The load stream uses the same builder, which also keeps the varying source port of (3) valid.
- The field engine varies the UDP source port per packet, so a firewall or a link aggregation sees
flowsdifferent 5-tuples. The IPv4 header is unchanged, so no IPv4 checksum fix is needed. STLTXCont()without a rate means 1 pps; the console multiplier (-m 5gbps,-m 80%) scales the load stream. The latency stream keeps its own rate because the global multiplier does not apply to latency streams.
| Tunable | Meaning | Why it matters |
|---|---|---|
--svlan |
Outer tag; 0 on pinned lab ports | The TX switch adds the S-tag itself on QinQ access ports |
--cvlan |
Production VLAN | Selects the service instance and VSI on the Leaf |
--size, --load_size |
Frame length without FCS (the NIC adds 4 bytes) | RFC 2544 sizes include the FCS: use size - 4 |
--pps, --pg |
Rate and pg_id of the latency stream | Unique pg_id per stream and port; at most 128 latency streams per instance |
--load_pg, --flows |
Optional load stream with flow statistics | Hardware counters on the X710 (single tag), scaled by -m |
--tos, --dport |
TOS byte, UDP class port | DSCP tests, firewall rules (32000-32099) |
Load it from the lab console like any TRex profile. -t must be the last option; -t --help prints the tunables. The
console also accepts the older -t name=value,name=value form and converts it.
confirm on the bench
The minimum latency frame is 62 bytes without FCS for a single tag (14 Ethernet + 4 tag + 20 IP + 8 UDP + 16
signature) - a 64-byte RFC 2544 frame (60 bytes without FCS) cannot carry a latency signature. TRex itself rejects such
a stream with "Need at least 16 payload bytes for payload rules" (TRex source src/stx/stl/trex_stl_fs.cpp). This is
why the load stream and the latency stream have separate sizes.
T1 - Layer 2 inside one VLAN
Goal
Loss and one-way latency between two APs in the same VLAN, for example VLAN 1314 between K-L11 (RZK) and C-L21 (RZC), in two variants: (A) higher resolution than the permanent 200 pps for a limited time, using the monitoring instance; (B) line rate, using the lab ports p4 = K-L11 and p7 = C-L21.
What you set and why
| Variant | Setting | Why |
|---|---|---|
| A | Two temporary latency streams at 1000 pps between the monitoring clients 10.3.14.101 (K-L11) and 10.3.14.110 (C-L21) | 1000 pps gives 1 ms loss resolution |
| A | Separate dynamic profile ID (0.adhoc, 1.adhoc) |
The permanent profile stays untouched; latency streams cannot be sped up with -m |
| A | Sent from the port that owns the client's EMU namespace (p0 for RZK APs, p1 for RZC APs) | The same MAC from another port would move between TX-switch ports |
| A | Unused pg_ids, for example 990/991 | Latency budget: 74 in use, guard rail 120, hard limit 128 |
| B | Lab clients 10.3.14.151 / 02:54:52:f0:00:04 (p4) and 10.3.14.160 / 02:54:52:f0:00:07 (p7), explicit MACs | Layer 2: the destination MAC is the remote lab port's fixed MAC, no ARP |
| B | Warm-up in both directions at low rate before any load | The fabric and the TX switches must learn both MACs first |
| B | A latency stream (128 B, 1000 pps) plus a load stream (flow stats) | Latency streams are software-processed and not meant for line rate |
How it works on the wire
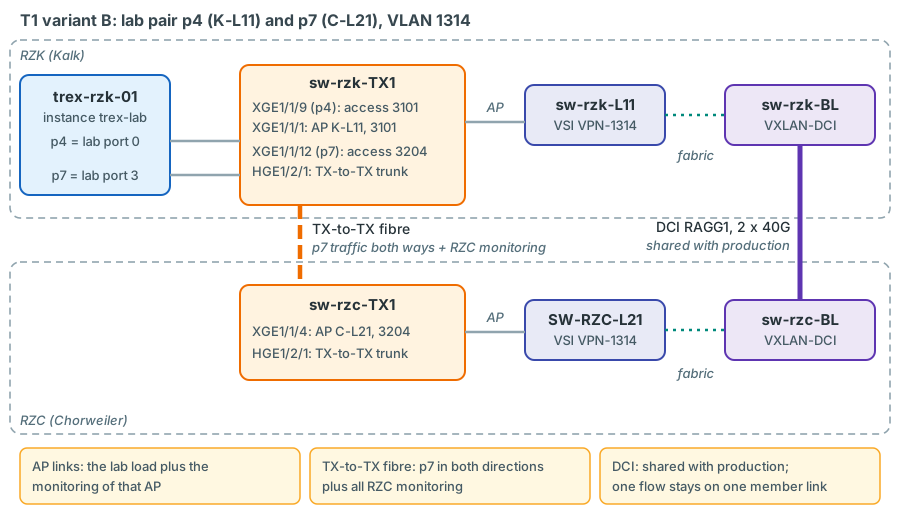
p4 sends single-tagged frames (C-tag 1314). The QinQ access port Ten-GigabitEthernet1/1/9 pushes S-VLAN 3101, the AP port Ten-GigabitEthernet1/1/1 pops it again, and sw-rzk-L11 maps the frame through service instance 1314 into VSI VPN-1314. VXLAN carries it via sw-rzk-BL, the DCI (RAGG1, MACsec) and sw-rzc-BL to SW-RZC-L21, whose AP port leads to sw-rzc-TX1 (S-VLAN 3204); the TX-to-TX trunk brings it back to sw-rzk-TX1, where Ten-GigabitEthernet1/1/12 pops the S-tag and delivers it to p7. The reverse direction is the mirror image. Because both lab ports are in RZK, the fibre carries p7's transmit traffic towards RZC and everything addressed to p7 back towards RZK.
Inter-DC caveat
In variant B the TX-to-TX fibre carries the lab load in both directions and all monitoring traffic of the RZC
APs. If that link runs at 10 Gbit/s, bidirectional line rate cannot fit: lab frames and RZC monitoring frames are
dropped together and Grafana shows loss on every RZC stream. Check the link speed of the inter-DC port on
sw-rzk-TX1 (display interface brief) and keep the lab rate below the link speed minus the monitoring load. The
DCI (2 x 40G, shared with production) carries the same load; an inter-DC line-rate test needs a change ticket.
Step by step
confirm on the bench This is a change to the monitoring instance: open a
normal (not read-only) console, use only the explicit profile IDs and never stop without them. Leave the console
with quit: disconnect would stop the traffic on every port the console owns.
$ cd /opt/trex/current && ./trex-console -p 4501 --async_port 4500
trex> stats -g                         # connection line must show port 4501
trex> start -f /opt/trexctl/profiles/raw/udp_vlan_latency.py --port 0.adhoc -d 30m -t --svlan 3101 --cvlan 1314 --smac 02:54:52:01:05:22 --dmac 02:54:52:0a:05:22 --sip 10.3.14.101 --dip 10.3.14.110 --sport 40990 --dport 32001 --pps 1000 --pg 990
trex> start -f /opt/trexctl/profiles/raw/udp_vlan_latency.py --port 1.adhoc -d 30m -t --svlan 3204 --cvlan 1314 --smac 02:54:52:0a:05:22 --dmac 02:54:52:01:05:22 --sip 10.3.14.110 --dip 10.3.14.101 --sport 40991 --dport 32001 --pps 1000 --pg 991
trex> stop --port 0.adhoc 1.adhoc --remove
The console tables show only the first four (stats -s) or five (stats -l) pg_ids, so with the 74 latency and
102 flow-stat streams of the monitoring profile they cannot show 990/991. Check that the pg_ids are free before the
start, and read their results, with a read-only Python client:
from trex.stl.api import STLClient

c = STLClient(server='127.0.0.1', sync_port=4501, async_port=4500)
c.connect()                                          # read-only: no acquire
print(c.get_active_pgids()['latency'])               # 990 and 991 must not be listed before the start
print(c.get_pgid_stats([990, 991])['latency'])       # after the start: latency of the ad-hoc pair
c.disconnect(stop_traffic=False)
confirm on the bench
$ cd /opt/trex/current && ./trex-console -p 4601 --async_port 4600
trex> stats -g                         # connection line must show port 4601
trex> portattr --port 0 3 --prom on    # as in the plan; only needed if a test uses MACs other than the fixed port MACs
trex> start -f /opt/trexctl/profiles/raw/udp_vlan_latency.py --port 0 -d 60 -t --cvlan 1314 --smac 02:54:52:f0:00:04 --dmac 02:54:52:f0:00:07 --sip 10.3.14.151 --dip 10.3.14.160 --pps 100 --pg 2001 --sport 40001
trex> start -f /opt/trexctl/profiles/raw/udp_vlan_latency.py --port 3 -d 60 -t --cvlan 1314 --smac 02:54:52:f0:00:07 --dmac 02:54:52:f0:00:04 --sip 10.3.14.160 --dip 10.3.14.151 --pps 100 --pg 2002 --sport 40002
trex> stats -s                         # warm-up: RX = TX for 2001 and 2002
While the warm-up runs, check on the switches that both MACs are learned (next tab). Then replace the warm-up by load streams and ramp:
trex> start -f /opt/trexctl/profiles/raw/udp_vlan_latency.py --port 0 -m 1gbps -d 10m --force -t --cvlan 1314 --smac 02:54:52:f0:00:04 --dmac 02:54:52:f0:00:07 --sip 10.3.14.151 --dip 10.3.14.160 --pg 2001 --sport 40001 --load_pg 2011 --load_size 1514
trex> start -f /opt/trexctl/profiles/raw/udp_vlan_latency.py --port 3 -m 1gbps -d 10m --force -t --cvlan 1314 --smac 02:54:52:f0:00:07 --dmac 02:54:52:f0:00:04 --sip 10.3.14.160 --dip 10.3.14.151 --pg 2002 --sport 40002 --load_pg 2012 --load_size 1514
trex> update --port 0 3 -m 5gbps
trex> update --port 0 3 -m 9gbps       # only within the agreed maximum
trex> tui                              # s = streams, l = latency, q = quit
trex> stop --port 0 3
verified VXLAN CR p. 13, L2 CR pp. 11 and 43
<sw-rzk-L11> display l2vpn mac-address vsi VPN-1314
<sw-rzk-TX1> display mac-address vlan 3101
<sw-rzk-TX1> display mac-address vlan 3204
<sw-rzk-TX1> display counters rate inbound interface Ten-GigabitEthernet 1/1/9
On sw-rzk-L11 the local lab MAC 0254-52f0-0004 (p4) must appear on the AP port and the remote one 0254-52f0-0007 (p7) on a tunnel. On sw-rzk-TX1 the lab MACs appear in the S-VLANs of their APs.
sketch - validate on the bench
from trex.stl.api import *

PROFILE = '/opt/trexctl/profiles/raw/udp_vlan_latency.py'

def tun(src, dst, sip, dip, pg, sport, load_pg=0):
    t = ['--cvlan', '1314', '--smac', src, '--dmac', dst, '--sip', sip, '--dip', dip,
         '--pg', str(pg), '--sport', str(sport)]
    return t + (['--load_pg', str(load_pg), '--load_size', '1514'] if load_pg else [])

c = STLClient(server='127.0.0.1', sync_port=4601, async_port=4600)   # trex-lab only
c.connect()
c.acquire(ports=[0, 3])
c.reset(ports=[0, 3])
c.set_port_attr(ports=[0, 3], promiscuous=True)
a, b = '02:54:52:f0:00:04', '02:54:52:f0:00:07'                  # fixed MACs of p4 and p7
c.add_streams(STLProfile.load_py(PROFILE, port_id=0, tunables=tun(a, b, '10.3.14.151', '10.3.14.160', 2001, 40001, 2011)).get_streams(), ports=[0])
c.add_streams(STLProfile.load_py(PROFILE, port_id=3, tunables=tun(b, a, '10.3.14.160', '10.3.14.151', 2002, 40002, 2012)).get_streams(), ports=[3])
c.start(ports=[0, 3], mult='1kpps', duration=600)                    # warm-up level first
# ... check MAC learning, then c.update(ports=[0, 3], mult='5gbps') and so on
c.wait_on_traffic(ports=[0, 3], rx_delay_ms=100)
print(c.get_pgid_stats([2001, 2002, 2011, 2012]))
c.disconnect()
What you should see
illustrative values
| Check | Variant A (get_pgid_stats) |
Variant B (1518-byte frames, 9 Gbit/s L2 per direction) |
|---|---|---|
| Packets | TX = RX for 990/991, 1000 pps each | stats -s: TX = RX for 2011/2012 at about 741 kpps; Rx bps shows N/A (X710 hardware counters count packets only) |
| Latency | Average close to the permanent inter-DC streams, for example 150 us | stats -l: latency stream 2001/2002 a few microseconds above the unloaded value; jitter low |
| Grafana | Ad-hoc streams do not appear (they are not exported) | Monitoring of K-L11 and C-L21 unchanged; no new loss on RZC streams |
The packet rate is arithmetic, not an illustration: 9 Gbit/s L2 at 1518 bytes = 9e9 / (1518 x 8) = 741 107 frames/s.
The TRex multiplier -m 9gbps counts L2 bits including the FCS; -m 90% counts L1 (with preamble and inter-frame gap).
Cleanup
Stop the streams (stop --port 0 3 in the lab console, the ad-hoc profile IDs in the monitoring console), check
stats -g for zero TX, leave the static MAC entries if the pins stay, annotate the end.
Risks
Unknown-unicast flooding if a destination MAC is not learned (warm-up, static MAC entries, keep a reverse stream
running - see Chapter 24); 10 Gbit/s extra on one DCI member link; saturation of the
TX-to-TX fibre; in variant A, a mistyped stop on trex-mon.
T2 - Layer 3 within VPN-CORE via the Border Leaf
Goal
The routed path VLAN 1314 to VLAN 1315 through the centralised gateway on sw-rzk-BL: delay added by the routing hop, line-rate capability, and the asymmetry between RZK and RZC sources (gateways exist only in Kalk).
What you set and why
| Setting | Value | Why |
|---|---|---|
| Lab port 0 (p4, K-L11) | L3 mode: source 10.3.14.151, gateway 10.3.14.1, VLAN 1314 | TRex resolves the gateway MAC by ARP |
| Lab port 2 (p6, K-BL) | L3 mode: source 10.3.15.156, gateway 10.3.15.1, VLAN 1315 | Second leg: AP K-BL also carries VLAN 1315 (p6 keeps its pin FWZ = K-BL); the BL must learn this address by ARP |
| Stream Ethernet header | No explicit MACs | Source = port MAC (the fixed src_mac, the MAC the gateway learned), destination = resolved gateway MAC |
| Frame size | At most 1518 bytes | The Vsi-interfaces have IP MTU 1500 by default; larger IP packets would be fragmented or dropped on the BL |
| Duration | Short trials, or a re-resolution plan | ARP entries on the BL age after 20 minutes |
Why the lab port must keep its own MAC in Layer 3 mode
l3 resolves the gateway with an ARP request sent from the port MAC, so sw-rzk-BL stores 10.3.14.151 with that
MAC. If the stream then used a different source MAC, the fabric would learn the stream's MAC, but the BL would keep
sending the return traffic to the port MAC - which no longer sends anything. After the 300-second MAC ageing time
that MAC is unknown everywhere and the return traffic is flooded. Using the port MAC for both ARP and data keeps
every table refreshed by the test traffic itself.
How it works on the wire
The frame leaves p4 with destination MAC = gateway MAC and C-tag 1314, crosses sw-rzk-TX1 (S-VLAN 3101) and sw-rzk-L11
into VSI VPN-1314 and reaches sw-rzk-BL over VXLAN. The BL routes it from Vsi-interface914 to Vsi-interface915 in
VPN-CORE: new source MAC (the gateway MAC), new destination MAC (p6's port MAC from its ARP table), TTL 64 becomes 63.
Because AP K-BL is a local port of sw-rzk-BL, the routed frame leaves through service instance 1315 on
Ten-GigabitEthernet1/3/6, crosses sw-rzk-TX1 in S-VLAN 3110 and reaches p6. An RZC source (for example p7 at C-L21)
would first cross the DCI to reach the gateway in Kalk; an RZC-to-RZC routed stream crosses it twice. Before an L3 test
from an RZC AP, check that its Leaf knows the gateway MAC ec9b-8b67-37b8 (display evpn route mac on that Leaf, entry
with flags BG as on sw-rzc-BL; EVPN Command Reference R630x, PDF p. 23): in February 2025 SW-RZC-L21 had no entry for
it, and a Leaf without it floods the routed frames as unknown unicast (Chapter 25).
Gateway ARP from a Leaf AP
Port 2 (K-BL) sits on a local port of the gateway, port 0 (K-L11) resolves 10.3.14.1 through a VXLAN tunnel. For a
centralised EVPN gateway HPE requires ARP flood suppression on the VTEPs, because the gateway does not answer ARP
requests for its MAC that arrive through VXLAN tunnels when remote ARP learning is disabled (EVPN Configuration
Guide R630x, PDF p. 28). At LVR no VSI has arp suppression enable and remote ARP learning is at its default
confirm on device in rollout phase 3. If port 0 stays unresolved while port 2
resolves, this is the likely cause; the fallbacks are arp suppression enable in VSI view on the Leafs (VXLAN Command
Reference R630x, PDF pp. 5-6 - a production change) or tests from the Border Leaf APs.
Step by step
confirm on the bench
trex> service --port 0 2
trex(service)> l3 --port 0 --src 10.3.14.151 --dst 10.3.14.1 --vlan 1314
trex(service)> l3 --port 2 --src 10.3.15.156 --dst 10.3.15.1 --vlan 1315
trex(service)> portattr --port 0 2     # "ARP Resolution" = gateway MAC, "VLAN" = 1314 / 1315
trex(service)> service --port 0 2 --off
trex> start -f /opt/trexctl/profiles/raw/udp_vlan_latency.py --port 0 -m 1gbps -d 10m -t --cvlan 1314 --sip 10.3.14.151 --dip 10.3.15.156 --pg 2001 --sport 40001 --load_pg 2011 --load_size 1514
trex> start -f /opt/trexctl/profiles/raw/udp_vlan_latency.py --port 2 -m 1gbps -d 10m -t --cvlan 1315 --sip 10.3.15.156 --dip 10.3.14.151 --pg 2002 --sport 40002 --load_pg 2012 --load_size 1514
trex> update --port 0 2 -m 9gbps
trex> stats -s
trex> stop --port 0 2
l3 needs service mode, sets the VLAN for control traffic and resolves at once. The stream itself must still
carry the C-tag (--cvlan): the port VLAN applies to ARP and ping only.
sketch - validate on the bench
from trex.stl.api import STLClient

c = STLClient(server='127.0.0.1', sync_port=4601, async_port=4600)
c.connect()
c.acquire(ports=[0, 2])
c.set_service_mode(ports=[0, 2], enabled=True)
c.set_l3_mode(port=0, src_ipv4='10.3.14.151', dst_ipv4='10.3.14.1', vlan=1314)   # resolves the gateway
c.set_l3_mode(port=2, src_ipv4='10.3.15.156', dst_ipv4='10.3.15.1', vlan=1315)
c.set_service_mode(ports=[0, 2], enabled=False)
# re-resolve later (traffic paused):  c.set_service_mode(ports=[0], enabled=True); c.resolve(ports=[0]); ...
verified L3 IP Services CR p. 33; VXLAN CR pp. 59-60; L2 CR p. 43
<sw-rzk-BL> display arp vpn-instance VPN-CORE
<sw-rzk-BL> display interface vsi-interface 914
<sw-rzk-BL> display interface vsi-interface 915
<sw-rzk-BL> display counters rate inbound interface Ten-GigabitEthernet 1/3/6
The ARP table shows 10.3.14.151 and 10.3.15.156 with the lab port MACs 0254-52f0-0004 and 0254-52f0-0006.
display interface vsi-interface 914
shows the gateway MAC ("hardware address"), the MTU and Input/Output packet counters
confirm on device whether hardware-routed packets are counted there; if not,
use the AP port counters.
planned format - trexctl not yet developed
trexctl apply -p l3bl-adhoc            # monitoring instance: temporary l3-bl group, EMU resolves the gateways
trexctl emu show                       # resolved gateway MAC = Vsi-interface MAC of sw-rzk-BL
trexctl stop -p l3bl-adhoc
trexctl test throughput --src K-L11 --src-vlan 1314 --dst K-BL --dst-vlan 1315 --sizes 512,1518 --duration 60
On the monitoring instance the same measurement already runs permanently as class L3-BL. For an ad-hoc pair there,
take the gateway MAC from emu_show_all --4-dg (the EMU default-gateway table) and send from the client's own
monitoring port with a separate profile ID, exactly as in T1 variant A.
What you should see
illustrative values RX = TX at 9 Gbit/s in both directions; the latency of the
routed streams is a few microseconds above an L2 stream between the same APs (one routing lookup, one extra VXLAN
re-encapsulation). portattr also shows a "Grat ARP" line: when it shows an interval, TRex sends gratuitous ARP for
the port address periodically (interval from the server option --arp-refresh-period); "off" means it does not.
ARP ageing during long L3 tests
The BL ages dynamic ARP entries after 20 minutes and probes them before deleting (three probes, 5 s apart by default;
L3 IP Services CR pp. 21-23). A TRex port answers ARP requests only in service mode. Whether the periodic
gratuitous ARP of the lab port keeps the BL entry alive is confirm on the bench:
watch display arp vpn-instance VPN-CORE for longer than 20 minutes. Until then, keep L3 trials shorter than the
ageing time or pause, re-resolve (service, arp --port 0, service --off) and resume.
Cleanup
Stop the streams. Optionally put the ports back to L2 mode (service, l2 --port 0 --dst <MAC>, service --off) if
the next test needs it. Nothing changes on the switches.
Risks
Line-rate routed traffic loads the BL and the AP links; an RZC variant doubles the DCI load; oversized frames would hit the BL CPU (fragmentation); in VLANs whose gateway is the firewall the same procedure becomes T3.
T3 - Through the DC firewall
Goal
Latency, loss and capacity between two production VLANs whose gateway is the DC firewall CPF-ZV05/06, at rates agreed with the firewall team.
What you set and why
| Setting | Value | Why |
|---|---|---|
| VLANs | <PROD-VLAN-A> and <PROD-VLAN-B> (TBD, gateway on the DC-FW VIP) |
Class L3-DCFW; candidates in Chapter 16 |
| Pins | p4 at K-L11 (VLAN A), p5 at K-L41 (S-VLAN 3105, VLAN B) - the default pins, no re-pin needed | Both APs must carry the VLANs (service instances; the VSI must exist on that Leaf) |
| Addresses | Lab addresses (.151-.166 scheme) reserved in IPAM and excluded from DHCP in both VLANs - a prerequisite | The firewall rule and the ARP entries refer to them |
| Firewall rule | Lab objects A <-> B, UDP 32000-32099 (includes 32009) and ICMP, accept, no NAT | Without a rule the firewall drops; with NAT the return path breaks |
| Flows | --flows 16 on the load stream (number agreed with the firewall team) |
One UDP 5-tuple = one firewall session; a single session is usually handled by one processing core |
| Rate plan | 10 Mbit/s, 100 Mbit/s, 500 Mbit/s, 1 Gbit/s, then in agreed steps, 3 minutes per step | The firewall serves most server VLANs: stepwise ramp, stop at first loss |
How it works on the wire
The lab port resolves the firewall VIP (gateway of VLAN A). In February 2025 both firewall clusters answered with the
MAC of the active member - no virtual MAC was seen confirm with the firewall team -
so the frames carry that member's MAC. They travel through the Leaf into VSI A, to a Border Leaf and over BAGG31
"Vlan-all" to the active firewall member, which routes them into VLAN B and sends them back over BAGG31 to VSI B, the
Leaf K-L41 and p5. Each 5-tuple creates one UDP connection entry on the firewall that the continuous traffic keeps
alive (Check Point default UDP virtual-session timeout 40 s). When the active member is in the other data centre, the
DCI is part of the path and the latency steps up. After a failover both lab ports keep sending to the old member's
MAC, because TRex resolves the gateway only when told to: stop, re-resolve (service, arp --port 0 1,
service --off) and start again (Chapter 15 describes the same effect on the
monitoring streams).
Step by step
- Ticket with the firewall team; agree the rate plan, the number of flows and the abort criteria (firewall CPU, connection table, any production alarm).
-
Check the pins and the static MAC entries on sw-rzk-TX1 (
display current-configuration interface
   Ten-GigabitEthernet1/1/10
). p4 at K-L11 and p5 at K-L41 are the default pins, so normally nothing changes. If p5 were pinned elsewhere at the time, re-pin it - one command on the lab port - and move its static MAC entry to the new S-VLAN first (see Chapter 24); the port then looks like this:verified L2 CR p. 202 (
port access vlan), configuration style from the TX switch design -
Resolve the VIPs in L3 mode exactly as in T2 (
l3 --port 0 --src <lab IP A> --dst <VIP A> --vlan <A>and the same for port 1 with VLAN B). - Start both directions at 10 Mbit/s with
--flows 16 --load_pg 2011(and 2012), hold 3 minutes, check RX = TX and the firewall view, thenupdate --port 0 1 -m 100mbpsand so on. - Stop at the first loss, at the agreed maximum, or when the firewall team asks. Note the last clean step.
What you should see
illustrative values RX = TX up to a certain step; latency through the firewall in the tens to hundreds of microseconds, rising with load before loss appears; 32 new connections on the firewall (16 per direction; the latency stream shares the first 5-tuple). A latency step of the size of the DCI round trip during the test means the active member changed; loss that starts at that moment and does not end means the ports still send to the old member's MAC - re-resolve as described above.
Cleanup
Stop the traffic (p5 keeps its default pin K-L41; if you re-pinned it for the test, restore the pin and its static MAC entries), ask the firewall team to clear the test sessions or let them time out, disable temporary rules.
Risks
The firewall's CPU and connection table are shared by most server VLANs; BAGG31 is shared with production VLANs; flooding in a production VLAN reaches real servers. Run it only with the firewall team on the line and with agreed abort criteria.
T4 - Through the Enterprise firewall into the TRex zone
Goal
The inter-VRF path VPN-CORE - ENT-FW - TRex zone: forwarding capacity and latency with stateless UDP, and connection handling (connections per second, concurrent sessions, goodput) with stateful ASTF traffic.
What you set and why
| Item | Firewall-zone option B (the plan's default) | Firewall-zone option A (alternative) |
|---|---|---|
| Zone VLAN | 4003 (VSI VPN-4003) on the existing bond BAGG10, reached through AP K-BL (S-VLAN 3110) | 1420 on a dedicated FW interface, AP "FW" (S-VLAN 3300 - defined on both TX switches; its ports are configured but shut down) |
| Zone-side lab port | p6, default pin FWZ (PVID 3110, TRex tags VLAN 4003); service instance 4003 on the K-BL AP port |
p6 pinned to AP FW (PVID 3300) |
| Zone lab client | 10.9.90.156 / 02:54:52:f0:00:06 (p6's fixed MAC) | 10.9.90.164 / 02:54:52:f0:00:06 (same MAC, index 14 address) |
| Zone gateway | VIP 10.9.90.1 on the VLAN 4003 interface | VIP 10.9.90.1 on the dedicated interface |
| Extra load on shared links | BAGG10 twice (in and out of the firewall) | BAGG10 once (inside leg) |
The plan recommends option B and uses it as the default; option A - a new firewall port per member on the TX switches, the customer's original wish - remains the alternative decision (Chapter 15). The steps below use option B. The route to the zone is already there: VPN-CORE has a default route via 10.9.0.22, and the firewall should advertise the zone into OSPF 1.
How it works on the wire
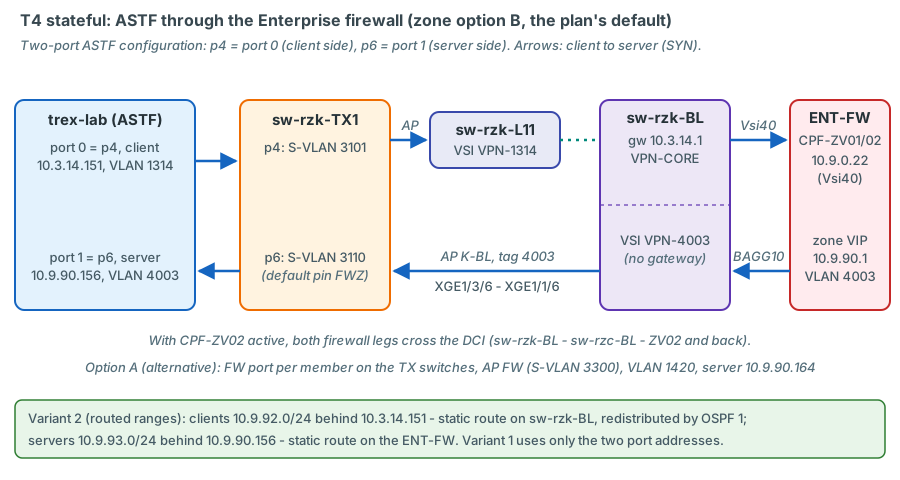
From p4 the frames reach sw-rzk-BL (gateway 10.3.14.1), are routed over Vsi40 (10.9.0.16/29) to the active ENT-FW
member (10.9.0.22), inspected, routed into the zone VLAN 4003 and sent back over BAGG10 into VSI VPN-4003 on the Border
Leaf, which delivers them through the K-BL attachment point (Ten-GigabitEthernet1/3/6, S-VLAN 3110 on sw-rzk-TX1) to
the zone-side lab port p6. With CPF-ZV02 active, both firewall legs cross the DCI. Stateless UDP creates one
connection per 5-tuple; with --flows 16 per direction the test measures forwarding, not connection set-up. ASTF opens
real TCP connections: SYN from the client, SYN-ACK from the TRex server side, data, FIN - every connection is a
firewall session with the full set-up and tear-down cost. In the stateless test the zone-side port sends to the MAC it
resolved for 10.9.90.1; as in T3, a cluster that answers with member MACs leaves that direction on the old MAC after a
failover until the port re-resolves.
Step by step - stateless
-
Verify the zone route on both Border Leafs.
verified L3 IP Routing CR p. 26
-
L3 mode on port 0 (10.3.14.151, gateway 10.3.14.1, VLAN 1314) and on port 2 = p6 (10.9.90.156, gateway 10.9.90.1, VLAN 4003; with option A 10.9.90.164 and VLAN 1420) as in T2.
- Start both directions at 10 Mbit/s with
--flows 16, ramp with the firewall team as in T3.
Step by step - stateful (ASTF)
ASTF assigns fixed roles: in every port pair the even port is the client side and the odd port the server side (TRex
ASTF guide, "Client/Server only mode"). In the four-port lab configuration p4 and p6 are ports 0 and 2 - both client
ports. The ASTF unit therefore uses its own configuration that lists only p4 and p6, in this order: p4 becomes port 0
(client side, VLAN 1314 at K-L11) and p6 port 1 (server side, firewall zone through its default pin FWZ), without
any re-pinning (Chapter 7).
-
The unit
trex-lab-astf.servicestarts TRex with this dedicated configuration file (--cfg /etc/trex/trex_lab_astf.yaml, Chapter 17);trex-lab.servicekeeps/etc/trex/trex_lab.yamlwith all four lab ports. Because only these two ports are listed, no other lab port can send during an ASTF test.sketch - validate on the bench keys from the TRex manual, "Platform YAML"
/etc/trex/trex_lab_astf.yaml- version: 2 interfaces: ['<PCI address of p4>', '<PCI address of p6>'] # order = port 0, port 1 port_limit: 2 prefix: lab zmq_pub_port: 4600 zmq_rpc_port: 4601 limit_memory: 3072 port_bandwidth_gb: 10 c: 4 port_info: - src_mac: '02:54:52:f0:00:04' # fixed lab-port MAC of p4 (the same as in trex_lab.yaml) ip: 10.3.14.151 # port 0 = p4, client side, AP K-L11 default_gw: 10.3.14.1 vlan: 1314 - src_mac: '02:54:52:f0:00:06' # fixed lab-port MAC of p6 ip: 10.9.90.156 # port 1 = p6, server side, firewall zone (FWZ = K-BL) default_gw: 10.9.90.1 vlan: 4003 # option A: ip 10.9.90.164, vlan 1420, same src_mac platform: master_thread_id: 10 latency_thread_id: 11 dual_if: - socket: 0 threads: [12, 13, 28, 29]systemctl cat trex-lab-astfshows the unit's start line with this file:trex-lab-astf.service (excerpt)ExecStart=/opt/trex/current/t-rex-64 -i --astf --cfg /etc/trex/trex_lab_astf.yaml --iom 0 --no-scapy-server --unbind-unused-ports--unbind-unused-portsis needed because the file lists only two of the four NIC2 ports confirm on the bench;--no-scapy-serverkeeps the start from restarting the Scapy helper that the host shares with trex-mon (Chapter 17). The server side learns VLAN and MAC from the incoming SYN (TRex ASTF guide, "Client clustering configuration": the server side "learn[s] the VLAN/MAC from the DUT") and answers from the port's own MAC to the firewall member that forwarded the SYN. -
Switch the lab instance to ASTF (the units conflict, so only one runs). The start runs
trex-cfg, which stops firewalld: check the host protection afterwards (Chapter 24).confirm on device unit names from Chapter 17
-
Choose the addressing variant.
Variant Clients Servers Network changes Limit 1 - single IPs 10.3.14.151 (the port address) 10.9.90.156 (the port address) none about 64 000 source ports per client IP and server port: enough for throughput and latency, not for CPS scaling 2 - routed ranges 10.9.92.1-254 behind 10.3.14.151 10.9.93.1-254 behind 10.9.90.156 static route on sw-rzk-BL, static route on the ENT-FW scalable For variant 2 the switch team adds the client route on sw-rzk-BL (OSPF 1 already redistributes static routes, so the firewall learns the return path), and the firewall team routes 10.9.93.0/24 to 10.9.90.156 and permits TCP 80/443 between the ranges.
verified syntax of the existing VPN-CORE static routes on sw-rzk-BL; L3 IP Routing CR pp. 84-85, 89-90
[sw-rzk-BL] ip route-static vpn-instance VPN-CORE 10.9.92.0 24 10.3.14.151 description TRex-ASTF-clientsLine What it does Why ip route-static vpn-instance VPN-COREStatic route in VRF VPN-CORE Same form as the existing routes "zur DC-FW" 10.9.92.0 24 10.3.14.151Client range via the TRex client port The port answers ARP for 10.3.14.151 description TRex-ASTF-clientsLabel Easy to find and remove after the campaign -
Load the profile and ramp the connection rate. The profile below sets
cps=1, so-mequals connections per second.--clients 0restricts generation to client port 0.sketch - validate on the bench derived from the TRex example
astf/http_simple.py/opt/trexctl/profiles/raw/astf_fw_http.pyimport argparse import os from trex.astf.api import * class FwHttp(object): def get_profile(self, tunables=(), **kwargs): p = argparse.ArgumentParser(description=os.path.basename(__file__)) p.add_argument('--c_range', default='10.3.14.151-10.3.14.151') # variant 2: 10.9.92.1-10.9.92.254 p.add_argument('--s_range', default='10.9.90.156-10.9.90.156') # variant 2: 10.9.93.1-10.9.93.254 a = p.parse_args(list(tunables)) c_lo, c_hi = a.c_range.split('-') s_lo, s_hi = a.s_range.split('-') ip_gen = ASTFIPGen(glob=ASTFIPGenGlobal(ip_offset='1.0.0.0'), dist_client=ASTFIPGenDist(ip_range=[c_lo, c_hi], distribution='seq'), dist_server=ASTFIPGenDist(ip_range=[s_lo, s_hi], distribution='seq')) return ASTFProfile(default_ip_gen=ip_gen, cap_list=[ASTFCapInfo(file='/opt/trex/current/avl/delay_10_http_browsing_0.pcap', cps=1)]) def register(): return FwHttp()confirm on the bench
trex> portattr                         # both ports: "ARP Resolution" shows the gateway MAC
trex> start -f /opt/trexctl/profiles/raw/astf_fw_http.py -m 10 -d 300 --clients 0
trex> stats -a                         # ASTF counters (non-zero lines)
trex> stop
trex> start -f /opt/trexctl/profiles/raw/astf_fw_http.py -m 100 -d 300 --clients 0 -t --c_range 10.9.92.1-10.9.92.254 --s_range 10.9.93.1-10.9.93.254
What you should see
from TRex docs The ASTF counter table (stats -a, or t in the TUI) lists client and
server columns with m_active_flows, m_est_flows, tcps_connattempt, tcps_connects, tcps_closed and more;
counters prefixed with an asterisk indicate errors (TRex ASTF guide, "Tutorial: Run TRex with simple HTTP profile").
illustrative values At -m 100: tcps_connattempt and tcps_connects on the
client grow by about 100 per second, tcps_accepts on the server matches, no asterisk counters; the permanent
L3-ENTFW monitoring streams (50 pps) stay within their baseline. Rising latency on those streams while ASTF runs is
the firewall working harder - an early abort signal.
Cleanup
stop, then sudo systemctl stop trex-lab-astf and sudo systemctl start trex-lab (check the host protection after
the start); no re-pinning is needed, because p6 keeps its default pin FWZ; remove the static route
(undo ip route-static vpn-instance VPN-CORE 10.9.92.0 24 10.3.14.151) and ask the firewall team to remove theirs;
disable temporary rules; let the sessions expire or clear them.
Risks
ASTF is the riskiest test of the platform: connection rate, session table and logging volume of the Enterprise firewall are shared by every inter-VRF flow of LVR. Rules that log every accepted connection produce one log entry per test connection - agree logging with the firewall team. With the default option B the zone traffic crosses BAGG10 twice, the bond that also carries the transfer VSIs 4000-4002 of VPN-WLAN, VPN-WAN and VPN-CORE. If option A were chosen instead, the zone ports on the TX switches would add the ClusterXL dependency of Chapter 24.
T5 - DSCP / QoS verification
Goal
Show that the DSCP values EF, AF41, CS1 and BE arrive unchanged, and whether any device in the path treats them differently under load.
What you set and why
| TOS byte | DSCP | PHB | Use |
|---|---|---|---|
| 0xB8 | 46 | EF | Voice-like traffic |
| 0x88 | 34 | AF41 | Interactive video |
| 0x20 | 8 | CS1 | Scavenger / bulk |
| 0x00 | 0 | BE | Default; the reference |
The DSCP is the upper six bits of the TOS byte (DSCP = TOS >> 2); the lower two bits are ECN. TRex sets the lowest
bit on every flow-stat and latency packet (set_tos_to_cpu(), TRex source src/stx/stl/trex_stl_fs.cpp), so the four
streams leave as 0xB9, 0x89, 0x21 and 0x01: the DSCP is unchanged, the ECN field reads 01. Four latency streams with
identical size (256 bytes, as in the monitoring DSCP class), rate (100 pps), AP pair and VLAN differ only in the TOS
byte and in their UDP source port, so a difference in latency or loss that follows the TOS byte is caused by
treatment, not by the path. They use UDP 32005 (class DSCP) and four dynamic profile IDs on one port, because each
start without a profile ID replaces the streams of the port.
How it works on the wire
The fabric configuration contains no QoS trust or scheduling policy, so all four classes should be forwarded alike and the TOS byte should arrive as it left TRex. VXLAN encapsulation does not touch the inner IP header. A firewall can re-mark or queue by DSCP depending on its configuration - that is what the L3-ENTFW variant tests.
Step by step
confirm on the bench
trex> start -f /opt/trexctl/profiles/raw/udp_vlan_latency.py --port 0.ef -d 10m -t --cvlan 1314 --smac 02:54:52:f0:00:04 --dmac 02:54:52:f0:00:07 --sip 10.3.14.151 --dip 10.3.14.160 --dport 32005 --sport 40021 --size 256 --pps 100 --pg 2021 --tos 0xb8
trex> start -f ... --port 0.af41 ... --sport 40022 --pg 2022 --tos 0x88
trex> start -f ... --port 0.cs1  ... --sport 40023 --pg 2023 --tos 0x20
trex> start -f ... --port 0.be   ... --sport 40024 --pg 2024 --tos 0x00
trex> service --port 3
trex(service)> capture record start --rx 3 --limit 40 -f vlan 1314 and udp dst port 32005
trex(service)> capture                 # status: packets collected
trex(service)> capture record stop --id 1 -o /tmp/dscp-p7.pcap
trex(service)> service --port 3 --off
trex> stats -l                         # compare 2021-2024
(The ... stand for the same tunables as in the first line.) The capture ID is printed by capture record start;
use that number. Capturing needs service mode on the receiving port; at 400 pps this is harmless. As in T1, the
destination is the C-L21 lab client: run the warm-up and a low-rate reverse stream from port 3, so that its MAC
stays learned.
confirm on the bench
tcpdump -nn -e -v -r /tmp/dscp-p7.pcap | head -20          # if tcpdump is installed
/opt/trexctl/venv/bin/python - <<'EOF'
from scapy.all import rdpcap, IP
for p in rdpcap('/tmp/dscp-p7.pcap'):
    if IP in p:
        print(p[IP].src, p[IP].dst, hex(p[IP].tos), 'DSCP', p[IP].tos >> 2)
EOF
tcpdump -v prints the TOS of every IPv4 packet in the IP header line, -e the VLAN tag. In Wireshark use the
display filter ip.dsfield.dscp == 46 and compare the counts per DSCP value.
What you should see
illustrative values Ten frames of each value with TOS 0xb9, 0x89, 0x21 and 0x01 -
the configured values plus bit 0, which TRex sets itself. stats -l shows the four streams within a few microseconds
of each other on the idle fabric.
| Received | Interpretation |
|---|---|
| All four as sent (0xB9, 0x89, 0x21, 0x01), equal latency | Expected in the fabric: no re-marking, no differentiation |
| EF and AF41 arrive with DSCP 0 (0x01, or 0x00 if the whole byte is rewritten) | A device bleaches DSCP (QoS policy or firewall setting) |
| DSCP unchanged, ECN field other than 01 (for example 0xBB: ECN 11) | ECN marking by a device, not DSCP re-marking |
| Unchanged values, but EF latency lower than BE under load | A device in the path queues by DSCP |
Because the four streams use different UDP source ports, an ECMP or link-aggregation hash can put one of them on another member link. A difference that stays with the TOS value when you swap the source ports is treatment; one that moves with the source port is the path.
For the "under load" question, run a T1 or T6 load with TOS 0 on the same AP pair while the four DSCP streams keep running, and compare their latency and loss.
Cleanup
stop --port 0.ef 0.af41 0.cs1 0.be --remove; delete the pcap or attach it to the report.
Risks
Low. Capture adds load only on the RX path of the port in service mode; keep the BPF filter and the limit tight. Do not switch trex-mon ports to full service mode for a capture - the monitoring instance runs in filtered mode for EMU.
T6 - Throughput: RFC 2544-style no-drop rate
Goal
The highest rate at which a path forwards every frame (the no-drop rate, NDR), per frame size, and the latency at that rate - with a report that also says which limit was reached.
What you set and why
RFC 2544 defines throughput as "the fastest rate at which the count of test frames transmitted by the DUT is equal to the number of test frames sent to it" (section 26.1), recommends the Ethernet frame sizes 64, 128, 256, 512, 1024, 1280 and 1518 bytes (section 9.1), trials of at least 60 seconds, allowing shorter trials during a search if the final value is confirmed with full-length trials (section 24), and "learning frames" sent before each trial so that address tables are primed (section 23).
| Frame size (incl. FCS) | Bytes on the wire (+ 20 preamble/IFG) | Max frames/s at 10 Gbit/s | L2 Gbit/s at line rate |
|---|---|---|---|
| 64 | 84 | 14 880 952 | 7.62 |
| 128 | 148 | 8 445 946 | 8.65 |
| 256 | 276 | 4 528 986 | 9.28 |
| 512 | 532 | 2 349 624 | 9.62 |
| 1024 | 1044 | 1 197 318 | 9.81 |
| 1280 | 1300 | 961 538 | 9.85 |
| 1518 | 1538 | 812 744 | 9.87 |
| IMIX 7:4:1 (64/594/1518) | 381.8 average | 3 273 680 | 9.48 |
Maximum frames/s = 10e9 / ((frame size + 20) x 8). The IMIX line matches the TRex example stl/imix.py (60/590/1514
bytes without FCS at 28:16:4 pps).
How it works: the search
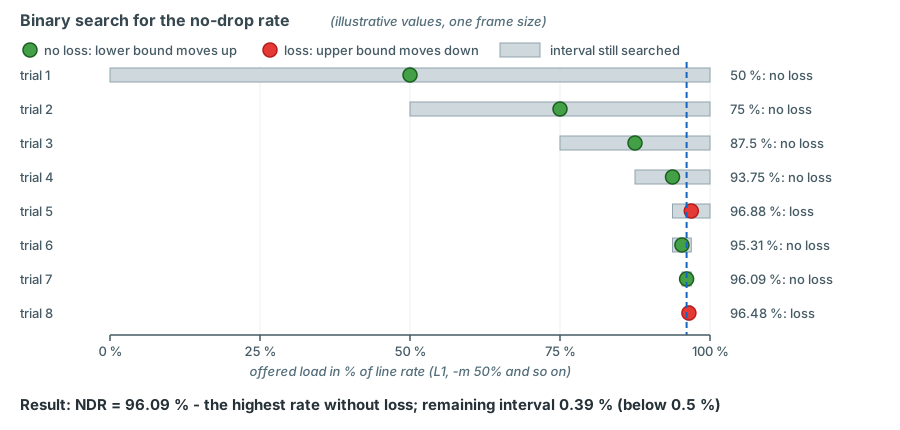
Each trial: clear the counters, send at the trial rate for a fixed time, wait for frames still in flight, compare TX and RX of the load pg_id. No loss: the rate becomes the new lower bound; loss: the new upper bound. With 20-second search trials, 2 seconds settle time, 5 seconds pause and a final 60-second confirmation, one frame size takes about five minutes; seven sizes plus IMIX about 40 minutes per direction.
Count loss per pg_id, not with port counters: a lab port is promiscuous and also receives broadcasts and flooded frames of the production VLAN, which port counters include.
Step by step
- Prove the tester first: the same search in loopback on the bench (two lab ports cabled together). A size at which TRex itself cannot reach zero loss cannot be measured through the network.
- Warm-up and static MAC entries as in T1; keep a low-rate reverse stream running during the whole search.
- Run the search with the sketch below, one frame size at a time, latency stream at 128 bytes.
- Confirm the found rate with a 60-second trial; record NDR in frames/s, L1 and L2 Gbit/s, latency at NDR.
sketch - validate on the bench
import time
from trex.stl.api import *

PROFILE = '/opt/trexctl/profiles/raw/udp_vlan_latency.py'
TX, RX = 0, 3                                    # p4 (K-L11) -> p7 (C-L21)
PG_LAT, PG_LOAD = 2001, 2011


def total(d):                                    # per-port dictionary with or without 'total'
    return d.get('total', sum(v for k, v in d.items() if k != 'total'))


def streams(frame_size):
    t = ['--cvlan', '1314', '--smac', '02:54:52:f0:00:04', '--dmac', '02:54:52:f0:00:07',
         '--sip', '10.3.14.151', '--dip', '10.3.14.160', '--pg', str(PG_LAT), '--pps', '1000',
         '--load_pg', str(PG_LOAD), '--load_size', str(frame_size - 4)]          # RFC size includes FCS
    return STLProfile.load_py(PROFILE, port_id=TX, tunables=t).get_streams()


def trial(c, pct, seconds):
    c.clear_stats()
    c.start(ports=[TX], mult='%g%%' % pct, duration=seconds)      # percent of L1 line rate
    c.wait_on_traffic(ports=[TX], rx_delay_ms=100)                 # count frames still in flight
    fs = c.get_pgid_stats([PG_LOAD])['flow_stats'][PG_LOAD]
    return total(fs['tx_pkts']), total(fs['rx_pkts'])


def ndr(c, frame_size, max_pct=100.0, res=0.5, seconds=20):
    c.remove_all_streams(ports=[TX])
    c.add_streams(streams(frame_size), ports=[TX])
    for pct in (1.0, 10.0):                                        # ramp check before the search
        tx, rx = trial(c, pct, 10)
        if rx < tx:
            raise RuntimeError('loss at %g %% - check the path before searching' % pct)
    lo, hi, best = 0.0, max_pct, None
    while hi - lo > res:
        mid = (lo + hi) / 2
        tx, rx = trial(c, mid, seconds)
        if tx > 0 and rx >= tx:
            lo, best = mid, mid
        else:
            hi = mid
        time.sleep(5)                                              # RFC 2544: let the path settle
    return best


c = STLClient(server='127.0.0.1', sync_port=4601, async_port=4600)   # never 4501
c.connect()
c.acquire(ports=[TX, RX])
c.reset(ports=[TX, RX])
c.set_port_attr(ports=[TX, RX], promiscuous=True)
rev = ['--cvlan', '1314', '--smac', '02:54:52:f0:00:07', '--dmac', '02:54:52:f0:00:04',
       '--sip', '10.3.14.160', '--dip', '10.3.14.151', '--pg', '2002', '--pps', '100']
c.add_streams(STLProfile.load_py(PROFILE, port_id=RX, tunables=rev).get_streams(), ports=[RX])
c.start(ports=[RX], duration=7200)             # reverse stream: keeps both MACs learned all the time
for size in (128, 256, 512, 1024, 1280, 1518):
    print(size, ndr(c, size, max_pct=95.0))                         # the agreed maximum
c.stop(ports=[RX])
c.disconnect()
max_pct is the ceiling agreed in the ticket. The two short trials at 1 % and 10 % keep the ramp rule of
Chapter 24: the binary search itself starts in the middle of the range, so the path must be
proven clean at low rates first. A partial-drop variant (loss below 0.001 %) only changes the pass condition; report
which one you used.
Never use the bundled TRex ndr tool on this server
TRex ships a ready-made NDR benchmark (./ndr --stl, TRex NDR benchmark documentation). Its STL front end
connects with the default RPC port 4501 - on trex-rzk-01 that is trex-mon - and has no option for another
port. It starts with reset() on all ports, which force-acquires them, stops all traffic and removes all streams
(TRex source trex/examples/stl/stl_ndr_bench_tool.py). Running it would wipe the permanent monitoring. Use the
sketch above, which connects to 4601, or the planned trexctl runner.
What you should see - and which limit you measured
illustrative values For K-L11 -> C-L21 at 1518 bytes the NDR lands slightly below 100 %, for example 99.8 %, because the AP links and the TX switch ports also carry the monitoring of those APs.
| Limit | Where | Signature in the result |
|---|---|---|
| AP link 10 Gbit/s, shared with monitoring | AP port egress on the TX switch or the Leaf | NDR = (10G - monitoring) / 10G; loss counted in display packet-drop interface on the egress port |
| TX-to-TX fibre | Inter-DC port of the TX switches | If 10G: NDR across it below the fibre capacity minus RZC monitoring; RZC monitoring shows loss during trials |
| TRex / X710 at small frames | Lab NIC | Loss also in the loopback test; non-zero queue_full in stats -g; result is a tester limit |
| DCI 2 x 40G with production | RAGG1 member links | Depends on production load at that moment; one flow stays on one member link |
| Routing hop MTU | Vsi-interfaces (1500) | Frames larger than 1518 bytes are not a valid L3 test |
| Firewalls | CPU, sessions | NDR far below 10G, often rising latency before loss |
Cleanup
Stop all lab streams, remove the reverse stream, annotate the end, store the table with the frame sizes, the NDR in frames/s and Gbit/s, the theoretical maximum and the protocol (RFC 2544 section 26.1 reporting format).
Risks
Every trial at the upper end is a line-rate burst into production devices: agree the ceiling, the paths (prefer the test VLANs 1314/1315 and intra-DC pairs) and the time window; inter-DC searches use the DCI.
T7 - Soak test
Goal
Stability over hours at a fixed rate: rare loss bursts, slow latency drift, effects of periodic events (MAC and ARP ageing, routing timers, firewall housekeeping, temperature).
What you set and why
| Setting | Value | Why |
|---|---|---|
| Rate | An agreed fraction of the NDR, for example 50-70 % | Headroom: the test is about stability, not capacity |
| Duration | 2-24 hours, always with -d |
A forgotten soak stops by itself |
| Class | L2, bidirectional, preferred | Both MACs are refreshed by the traffic itself; no ARP ageing involved |
| Latency stream | 1000 pps, 128 bytes | 1 ms loss resolution next to the load stream |
| Recording | Poll every 10 s into a CSV file | The console shows cumulative values only |
How it works on the wire
As in T1 (L2) or T2 (L3). In a bidirectional L2 soak every frame refreshes the source-MAC entries in the TX switches, Leafs and EVPN, so nothing ages. A unidirectional soak lets the destination MAC age after 300 seconds (Comware default, L2 CR p. 28) and turns the test into a flood - that is why the reverse stream is mandatory. An L3 soak depends on the ARP behaviour described in T2.
Step by step
- Run the warm-up and ramp of T1 variant B up to the soak rate, both directions, with
-d 8h. - Start the recorder in a second terminal (
tmux), annotate the start. - Check the CSV, the monitoring dashboards and
display counters rate inbound interfaceon the AP ports at agreed intervals.
sketch - validate on the bench
import csv
import time
from trex.stl.api import STLClient

PGS = [2001, 2002, 2011, 2012]                   # latency and load pg_ids of both directions


def total(d):
    return d.get('total', sum(v for k, v in d.items() if k != 'total'))


c = STLClient(server='127.0.0.1', sync_port=4601, async_port=4600)
c.connect()                                      # statistics only: no acquire
prev = {}
with open('/data/trexctl/reports/T7-0001.csv', 'w', newline='') as f:
    w = csv.writer(f)
    w.writerow(['time', 'pg_id', 'tx', 'rx', 'lost', 'lat_avg_us', 'lat_total_max_us'])
    while True:
        st = c.get_pgid_stats(PGS)
        now = time.strftime('%Y-%m-%dT%H:%M:%S')
        for pg in PGS:
            fs = st['flow_stats'].get(pg, {})
            tx, rx = total(fs.get('tx_pkts', {})), total(fs.get('rx_pkts', {}))
            ptx, prx = prev.get(pg, (tx, rx))
            prev[pg] = (tx, rx)
            lat = st['latency'].get(pg, {}).get('latency', {})
            w.writerow([now, pg, tx - ptx, rx - prx, max(0, (tx - ptx) - (rx - prx)),
                        lat.get('average', ''), lat.get('total_max', '')])
        f.flush()
        time.sleep(10)
The per-interval loss is approximate (frames in flight at the sampling moment); the cumulative TX - RX at the end of
the test is exact. last_max covers only the last 0.5-second window, so a 10-second poll records total_max and the
histogram instead (Chapter 5).
What you should see
illustrative values Lost = 0 in every 10-second row, average latency flat within a
few microseconds over the whole run, total_max stepping up only a few times. Loss bursts at regular intervals point to
periodic events; correlate their timestamps with switch logs (display logbuffer) and the change calendar.
Cleanup
Let the duration expire or stop the ports, stop the recorder, archive the CSV with the report, annotate the end.
Risks
A soak occupies the lab ports and part of the AP and fibre capacity for hours: announce it, keep the rate well below the NDR, and never leave a unidirectional or L3 soak without the measures above.
Key takeaways
- Every test follows define, pre-checks, annotate, execute, observe, post-checks, report - an aborted test still needs post-checks and a report.
- Know your console: 4501 is trex-mon (read-only by default), 4601 is trex-lab; inside trex-lab, p4-p7 are ports 0-3, and in the two-port ASTF configuration p4 is port 0 and p6 port 1.
- Layer 2 lab tests name the fixed lab-port MACs explicitly and need a warm-up in both directions and a reverse stream
for the whole test; Layer 3 tests use L3 mode and the port's own MAC - the same fixed MAC (
src_mac). - Every lab port keeps its fixed MAC (
02:54:52:f0:00:04for p4 ...:07for p7) across re-pins; only the lab IP follows the pinned AP (.151 + AP index - 1: K-L11 .151, K-L41 .155, K-BL .156, C-L21 .160, zone 10.9.90.156 on p6 =FWZ). The IPAM reservation and DHCP exclusion of the lab range are a prerequisite of the first test. - Latency streams are not scaled by the multiplier: run a load stream with flow statistics plus a low-rate latency stream, size frames so that the 16-byte signature fits, and build them with UDP checksum 0.
- Firewall tests are joint tests with the firewall team: multiple flows, stepwise ramps, agreed abort criteria; ASTF needs the even/odd port pair and its two-port configuration. After a firewall failover, lab ports that resolved a firewall address still send to the old member's MAC until they re-resolve.
- DSCP verification = streams that differ only in the TOS byte (and source port), plus a capture on the receiving port; TRex itself sets TOS bit 0, so EF leaves as 0xB9.
- An NDR is only meaningful together with the limit that produced it: AP link, TX-to-TX fibre, tester, DCI or firewall.
- Never run the bundled
./ndrtool on this server - it always connects to 4501 (trex-mon) and resets all ports - and run other example scripts only against 4601.
Check your understanding
1. You want 1 ms loss resolution between K-L11 and C-L21 for half an hour. Why do you not simply run update -m on the monitoring ports?
The monitoring streams are latency streams, and the global multiplier does not apply to latency streams (TRex
stateless guide, "Per stream latency/jitter/packet errors"). update would also act on the whole profile of the
port. Instead you add two temporary latency streams at 1000 pps under a separate profile ID (0.adhoc,
1.adhoc), within the latency budget, and remove them afterwards.
2. In a lab L2 test p4 sends to 02:54:52:f0:00:07 (p7's fixed MAC) before p7 has sent anything. What happens?
Neither sw-rzk-TX1 (S-VLAN 3101) nor the fabric has learned that MAC. The TX switch floods the frames into S-VLAN 3101 - to the AP and to the trex-mon trunk ports - and sw-rzk-L11 floods them into VSI VPN-1314, i.e. to every port and every VTEP of VLAN 1314, including the DC firewall via BAGG31. Warm-up traffic in both directions and static MAC entries on the TX switches prevent this.
3. Why must the lab port keep its own MAC as the source MAC in an L3 test?
The gateway learned the client's IP address together with the MAC that sent the ARP request, i.e. the port MAC. Return traffic is sent to that MAC. If the stream used another source MAC, nothing would refresh the port MAC in the MAC tables; after 300 seconds it would be unknown and the routed return traffic would be flooded.
4. The ASTF test should run from K-L11 (VLAN 1314) to the firewall zone. Why does it need its own configuration file?
ASTF fixes the roles per port pair: the even port is the client side, the odd port the server side, and both sides of a connection belong to the same pair. In the four-port lab configuration p4 and p6 are ports 0 and 2 - both client ports. A two-port configuration that lists p4 first and p6 second makes p4 port 0 (client) and p6 port 1 (server), and it also guarantees that no other lab port generates traffic.
5. An NDR search at 64 bytes finds 93 %. What do you check before reporting a fabric limit?
Whether the tester reaches zero loss at 64 bytes in loopback on the bench, and whether stats -g showed
queue_full during the trials. If the loopback test also loses frames, 93 % is a TRex/X710 limit. Also check the
AP and fibre egress drops (display packet-drop interface) and whether the monitoring on the same AP explains the
gap.
6. A 4-hour L3 soak through sw-rzk-BL loses all return traffic after about 20 minutes. Most likely cause?
The BL's dynamic ARP entry for the lab client aged out (20 minutes by default) and its probes were not answered, because a TRex port answers ARP only in service mode. Re-resolve at intervals shorter than the ageing time, verify the gratuitous-ARP behaviour on the bench, or run the soak as an L2 test.
7. What tells you that EF is treated differently from BE, and what does not?
Different latency or loss of otherwise identical EF and BE streams under load shows differentiated queuing. A changed DSCP (the upper six bits) in the capture shows re-marking. Equal latency on an idle network proves nothing about treatment under congestion. The lowest TOS bit is set by TRex itself (EF leaves as 0xB9), and a change in the two lowest bits is ECN, not DSCP.
References
- RFC 2544, Benchmarking Methodology for Network Interconnect Devices, sections 9.1, 23, 24, 26.1 and 26.3. https://www.rfc-editor.org/rfc/rfc2544
- TRex stateless guide (https://trex-tgn.cisco.com/trex/doc/trex_stateless.html): "Tutorial: Advanced traffic profile", "Tutorial: Per stream statistics" (Table 14), "Tutorial: Per stream latency/jitter/packet errors", "Port service mode", "Packet capturing", "Tutorial: Field Engine, tuple generator".
- TRex STL Python API (cp_stl_docs):
start,update,stop,wait_on_traffic,get_pgid_stats,set_l3_mode,resolve,set_service_mode,start_capture. - TRex ASTF guide (https://trex-tgn.cisco.com/trex/doc/trex_astf.html): "Tutorial: Run TRex with simple HTTP profile", "Client/Server only mode", "Client clustering configuration".
- TRex manual (https://trex-tgn.cisco.com/trex/doc/trex_manual.html): "Platform YAML (--cfg argument)", "Command line options"; TRex NDR benchmark documentation (https://trex-tgn.cisco.com/trex/doc/trex_ndr_bench_doc.html).
- TRex source (trex-core master):
scripts/stl/flow_stats_latency.py,scripts/stl/imix.py,scripts/astf/http_simple.py,src/stx/stl/trex_stl_fs.cpp(TOS bit 0 on statistics packets),scripts/trex-cfg(stops firewalld); underscripts/automation/trex_control_plane/interactive/trex/:utils/parsing_opts.py(console options, tunables, multiplier units),common/trex_client.py(disconnect(), consolearp) andexamples/stl/stl_ndr_bench_tool.py. - HPE FlexFabric 5950 Layer 2 - LAN Switching Command Reference R630x: PDF pp. 11, 28, 43, 47, 64, 202.
- HPE FlexFabric 5950 VXLAN Command Reference R630x: PDF pp. 5-6 (
arp suppression enable), 13, 59-60. - HPE FlexFabric 5950 EVPN Configuration Guide R630x: PDF p. 28 (centralised EVPN gateway and ARP flood
suppression). HPE FlexFabric 5950 EVPN Command Reference R630x: PDF p. 23 (
display evpn route mac). - HPE FlexFabric 5950 Layer 3 - IP Services Command Reference R630x: PDF pp. 21-23 (ARP ageing), p. 33.
- HPE FlexFabric 5950 Layer 3 - IP Routing Command Reference R630x: PDF pp. 26, 84-85, 89-90.
- HPE FlexFabric 5950 Network Management and Monitoring Command Reference R630x: PDF p. 423.
- Grafana documentation: "Annotate visualizations"; HTTP API "Annotations" (POST /api/annotations).
- LVR running configuration sw-rzk-BL (Feb 2025): VPN-CORE static routes, Vsi-interface914/915, BAGG10; diag
sw-rzk-BL
display arp all(10.9.0.22 and 10.9.0.35 resolved to member MACs via the DCI tunnel); diag SW-RZC-L21display evpn route mac(no entry for ec9b-8b67-37b8).