8. InfluxDB
In this chapter
You will learn
- why the platform stores its measurements in a time-series database and what InfluxDB 2.x consists of
- how organisations, buckets, retention periods and scoped tokens are used for LVR (
trex,trex_longterm) - the data model - measurement, tags, fields, timestamp, series - and the five LVR measurements
- which values must be tags and which must be fields, and how large the LVR cardinality is
- how the exporter writes data and how to read it back with Flux, step by step
- how the downsampling task, backups, retention and upgrades work, and which mistakes to avoid
Prerequisites: Chapter 5 (what TRex counts and how latency is measured)
TRex keeps its counters in memory and forgets them when the instance restarts; Grafana draws pictures but stores no measurements. Between the two sits InfluxDB: every 2 seconds the exporter writes the TRex counters as a few hundred data points, which stay for 90 days at full resolution and for two years as 1-minute aggregates. Every dashboard, alert and outage report reads from this database, so you need to know what is stored, under which names and with which meaning - and how to ask InfluxDB directly when a dashboard does not answer your question.
Why a time-series database
A time-series database (TSDB) is optimised for values that are measured repeatedly and stamped with the time of measurement. Such data is append-only (new points always carry the current time), consists of many parallel series (for LVR about 176 TRex streams, 8 ports and 2 instances), is queried by time range ("the last 6 hours") and mostly aggregated over time (nobody reads 2-second values for a month), and expires (details for weeks, trends for years).
A relational database can store this, but it indexes every row and deletes old rows one by one. A TSDB groups values by series and time, compresses runs of similar values, and deletes old data by dropping whole time blocks. That is why InfluxDB takes thousands of values per second on the TRex server without disturbing the DPDK cores, and why a 90-day query for one stream is fast.
In the LVR platform
InfluxDB OSS 2.x runs on the TRex server trex-rzk-01 itself, next to Grafana and the two TRex instances. Only
local processes talk to it: the exporter writes, Grafana reads, and administrators use the influx CLI. The
version line is InfluxDB OSS 2.9.x (2.9.1 is current, released 12 May 2026).
InfluxDB 2.x architecture
One binary, several components
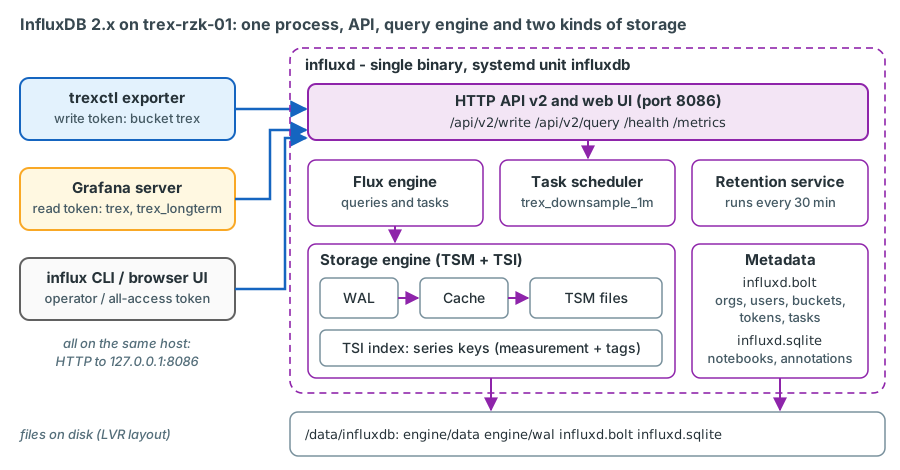
Everything server-side is one process, influxd, started by the systemd unit influxdb. Inside it:
| Component | What it does |
|---|---|
| HTTP API v2 and UI | All clients use HTTP on port 8086: /api/v2/write, /api/v2/query (Flux), /health, /metrics (Prometheus format). The same port serves the web UI. |
| Storage engine | Points go first to the WAL (write-ahead log, fsynced) and to an in-memory cache, where they are immediately queryable. The cache is periodically written to compressed, columnar TSM files, compacted in the background. The TSI index maps measurement and tag values to series. |
| Metadata store | BoltDB file influxd.bolt: organisations, users, buckets, tokens, tasks. SQLite file influxd.sqlite: notebook and annotation metadata. |
| Flux engine, task scheduler | Execute Flux queries and run tasks such as the LVR downsampling task. |
| Retention service | Every 30 minutes (default) deletes data that has left its bucket's retention period. |
The command-line client influx is a separate package with its own version (CLI 2.8.0 at the time of writing) and
uses the same HTTP API.
Configuration and files
The RPM package reads /etc/influxdb/config.toml and by default stores everything under /var/lib/influxdb
(engine/, influxd.bolt, influxd.sqlite). The planned LVR configuration moves the data to the /data file system
and binds the API to the loopback address verified (keys from the InfluxDB OSS v2
Configuration options reference; the values are the planned LVR settings):
bolt-path = "/data/influxdb/influxd.bolt"
engine-path = "/data/influxdb/engine"
http-bind-address = "127.0.0.1:8086"
query-memory-bytes = 2147483648
storage-cache-max-memory-size = 2147483648
| Key | Meaning | Why for LVR |
|---|---|---|
bolt-path |
Metadata file. The SQLite file follows it (default: same directory). | All InfluxDB state on /data, not on the OS disk |
engine-path |
TSM and WAL files | The bulk of the data |
http-bind-address |
Listen address of API and UI (default :8086, all interfaces) |
Only local clients exist |
query-memory-bytes |
Maximum memory of a single query (default unlimited) | A runaway query cannot starve the TRex processes |
storage-cache-max-memory-size |
Cache size per shard before writes are rejected (default 1 GiB) | Headroom |
Using the web UI
Because the API listens on 127.0.0.1 only, open the UI through an SSH tunnel from your workstation:
ssh -L 8086:127.0.0.1:8086 <user>@trex-rzk-01, then browse to http://localhost:8086.
InfluxDB 2.x, not InfluxDB 3
InfluxData now presents InfluxDB 3 (Core, Enterprise) as its current product. It is not a newer 2.x but a rewrite
with a different storage engine, SQL and InfluxQL as query languages, and no Flux. InfluxDB 2.x remains maintained
(2.9.0 and 2.9.1 were released in May 2026) and Flux is in maintenance mode: supported in 1.x and 2.x, but without new
features. The platform's dashboards, alerts and downsampling task are written in Flux, so it stays on 2.x. In the
InfluxData RPM repository the 2.x server package is influxdb2, while 3.x ships as influxdb3-core and
influxdb3-enterprise, so a routine dnf update does not jump to 3.x.
Organisations, buckets, retention and tokens
Organisation and buckets
An organisation is a workspace that owns buckets, tasks, dashboards and users. LVR uses one organisation, lvr.
A bucket is a named place where points are stored, combined with a retention period: points older than the retention period are deleted automatically. The platform uses two buckets:
| Bucket | Content | Resolution | Retention |
|---|---|---|---|
trex |
Everything the exporter writes: streams, ports, global state, tests, events | Raw, one point per stream every 2 s | 90 days |
trex_longterm |
Aggregates written by the downsampling task | 1 minute | 730 days |
Inside a bucket, data is stored in shards, one per shard group, and each shard group covers a fixed time span.
By default the shard group duration follows the retention period: 1 hour for retention below 2 days, 1 day between 2
days and 6 months, 7 days above 6 months. So trex uses 1-day shard groups and trex_longterm 7-day shard groups.
How retention is enforced
The retention service runs every 30 minutes and deletes whole shard groups, never individual points. A shard group
is deleted only when its entire time range lies beyond the retention period. Data therefore survives at least the
retention period and at most retention period plus one shard group duration: up to 91 days in trex and up to 737
days in trex_longterm. Until it is deleted, expired data remains queryable.
Tokens
Every API request carries a token in the header Authorization: Token <token>. InfluxDB 2.x knows three kinds:
| Token type | Grants | Used for |
|---|---|---|
| Operator token | All organisations, including server-level operations | Created by influx setup; needed for backup and full restore; kept in the password safe |
| All-access token | Everything within one organisation | Administration, if desired |
| Read/write token | Read and/or write on specific buckets | Applications |
The LVR design gives each application only what it needs: the exporter can write bucket trex and nothing
else; Grafana can read trex and trex_longterm and cannot change or delete anything.
influx setup --org lvr --bucket trex --retention 90d \
    --username influxadmin --password '<STRONG-PASSWORD>' --force
influx bucket create --org lvr --name trex_longterm --retention 730d
influx bucket list --org lvr        # shows IDs, retention and shard group duration
influx auth create --org lvr --description "trexctl exporter (write trex)" \
    --write-bucket <ID-of-trex>
influx auth create --org lvr --description "grafana (read)" \
    --read-bucket <ID-of-trex> --read-bucket <ID-of-trex_longterm>
verified flags checked against the InfluxDB OSS v2 CLI reference (influx setup,
influx bucket create, influx auth create; --read-bucket and --write-bucket take bucket IDs and may be
repeated). Replace the placeholders with the real values.
Tokens are hashed from 2.9.0 on
Since InfluxDB 2.9.0, tokens are stored only as hashes. A token string is shown once, at creation, and cannot be
displayed later - copy it into the password safe immediately. influx setup also saves the operator token in
plain text in the CLI configuration (~/.influxdbv2/configs) of the user who ran it - protect that file. A
backup from 2.9 contains no plain-text operator token, so a full restore needs
influx restore --full --operator-token <token>. A lost application token is simply replaced.
The data model
Points: measurement, tags, fields, timestamp
InfluxDB stores points. A point has four parts, and line protocol - the text format used for writing - shows them in this order:
<measurement>[,<tag_key>=<tag_value>...] <field_key>=<field_value>[,<field_key>=<field_value>...] [<timestamp>]
| Part | Meaning | Rules |
|---|---|---|
| Measurement | What kind of thing is described, like a table name: trex_stream |
Required, one per point |
| Tag set | Key/value pairs that describe which object was measured: src_ap=K-L11 |
Optional; keys and values are always strings; indexed |
| Field set | The measured values: lat_avg_us=86.4 |
At least one field; typed values; not indexed |
| Timestamp | When the values were measured, as Unix time | Optional (server time is used if missing); default precision nanoseconds |
The first unescaped space separates measurement and tags from the fields, the second one separates the fields from
the timestamp. Field values are typed: a plain number is a 64-bit float (200, 86.4), a trailing i makes a
signed integer (0i), a trailing u an unsigned integer, double quotes a string ("text"), and t/f/true/
false a boolean.
Series
A series key is the combination of measurement and tag set; InfluxDB counts series cardinality as the number
of distinct measurement + tag set + field key combinations. Every TRex stream is one series key (its tags are unique,
at least through pg_id), and every field of the stream is stored as its own time-ordered column. Values of one field
of one stream sit together, sorted by time, and compress well because they change little from point to point.
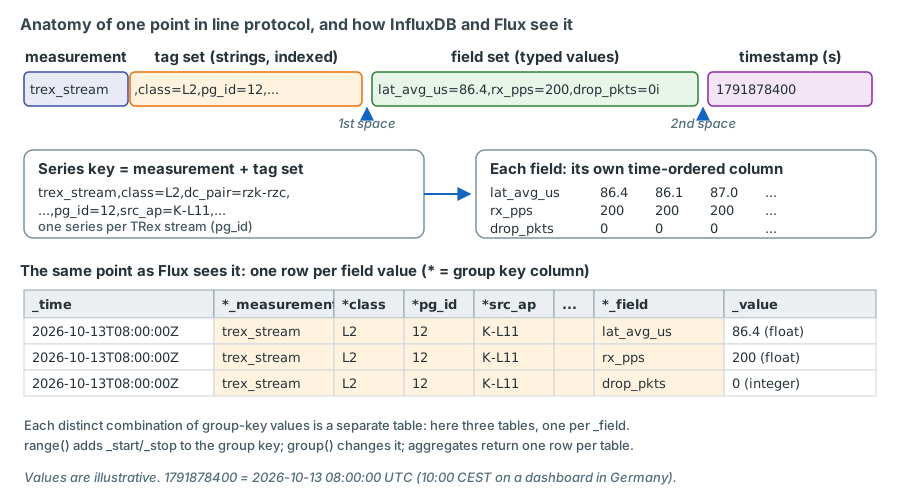
Flux shows the data in a third form: a stream of tables. Every field value is one row with the columns _time,
_measurement, one column per tag, _field and _value. Rows are split into tables by the group key - by
default measurement, all tags and the field, so each table holds one field of one series. Most Flux confusion comes
from forgetting which columns are in the group key.
The LVR measurements
The exporter writes five measurements into bucket trex. The field names below are the ones used throughout this
course; chapter 18 explains how the exporter computes them.
| Measurement | Tags | Fields | Written |
|---|---|---|---|
trex_stream |
pg_id, name, class, src_ap, dst_ap, src_dc, dst_dc, dc_pair, src_vlan, dst_vlan, vrf, tos, dscp, instance, profile, kind |
see next table | every 2 s per stream |
trex_port |
instance, port, role |
tx_pps, rx_pps, tx_bps, rx_bps, ierrors, oerrors, tx_queue_full, link_up |
every 2 s per TRex port |
trex_global |
instance |
cpu_util, rx_cpu_util, bw_per_core, rx_drop_bps, queue_full, active_streams, unresolved_clients, exporter_lag_ms |
every 2 s per instance |
trex_test |
test_id, type, src_ap, dst_ap, vlan, size |
offered_bps, offered_pps, rx_bps, loss_pct, lat_avg_us, lat_max_us, ndr_bps |
by the lab test runners |
trex_event |
kind (annotation, apply, stop, test, gateway_mac_changed) |
text |
on events, for example trexctl annotate, or a firewall gateway MAC change detected by the gateway-MAC tracker of trexctl |
The fields of trex_stream differ between the two kinds of stream described in chapter 5.
Every stream has loss fields; only latency streams (kind=latency) have latency fields, and only for intervals in
which the stream received packets. A flow-stat stream (kind=flowstat) measures loss only - there is no latency to
store for it.
| Field | Type | Meaning | Streams |
|---|---|---|---|
tx_pkts, rx_pkts |
integer | Cumulative packet counters since the stream was started | all |
drop_pkts |
integer | Lost packets reported in this 2-s interval; the exporter reports loss once it is confirmed - one poll late - so packets that are merely in flight at a poll are never counted (chapter 18) | all |
drop_pkts_total |
integer | Cumulative lost packets | all |
tx_pps, rx_pps, tx_bps, rx_bps |
float | Packet and bit rates over the interval | all |
rx_ok |
boolean | Receive status of the stream in this interval as a true/false flag; the exact rule is fixed with the exporter implementation confirm on the bench | all |
lat_avg_us |
float | TRex average: a low-pass filtered average (new = old/2 + last 0.5-s window/2), so it reflects roughly the last second or two |
latency |
lat_min_us |
float | TRex total_min: lowest latency over the stream lifetime |
latency |
lat_max_us |
float | Maximum latency within this interval: the upper edge of the highest histogram bucket that grew in the interval, so it has bucket resolution (in the example below the 90-99 µs bucket received packets, so it is reported as 100 µs) | latency |
lat_last_max_us |
float | TRex last_max: maximum of the last 0.5-s server window only - stored for reference, never used as the interval maximum |
latency |
lat_total_max_us |
float | TRex total_max: highest latency since the stream started - only ever grows |
latency |
jitter_us |
float | Interarrival jitter as defined in RFC 3550 appendix A.8 | latency |
seq_dropped, seq_ooo, seq_dup |
integer | Sequence-number based loss, out-of-order and duplicate counters (TRex err_cntrs) |
latency |
hist_<key> |
integer | Packets whose latency fell into the histogram bucket starting at <key> µs during the interval (the delta of TRex's cumulative histogram) |
latency |
Why lat_max_us cannot simply be TRex's maximum
TRex offers two maxima, and neither fits a 2-second polling interval. total_max covers the whole stream
lifetime: after the first spike it never comes down again. last_max covers only the last 0.5-second window:
polling every 2 seconds, the exporter would see one window in four and miss three quarters of all peaks. The
latency histogram, however, is cumulative and complete. Its buckets are logarithmic: below 10 µs, then 10 µs
steps up to 100 µs, 100 µs steps up to 1 ms, 1 ms steps up to 10 ms, and so on. Subtracting the previous
poll's bucket counts gives the distribution of exactly this interval, and the upper edge of the highest bucket that
grew is the interval maximum - accurate to one bucket width. TRex's last_max is still written, as
lat_last_max_us, but only for reference.
Example points in line protocol illustrative values (each point is one long line):
trex_stream,class=L2,dc_pair=rzk-rzc,dscp=BE,dst_ap=C-L11,dst_dc=rzc,dst_vlan=1314,instance=trex-mon,kind=latency,name=L2_K-L11_C-L11_1314,pg_id=12,profile=monitoring-default,src_ap=K-L11,src_dc=rzk,src_vlan=1314,tos=0x00,vrf=VPN-CORE tx_pkts=1728040i,rx_pkts=1728040i,drop_pkts=0i,drop_pkts_total=0i,tx_pps=200,rx_pps=200,tx_bps=211200,rx_bps=211200,rx_ok=true,lat_avg_us=86.4,lat_min_us=79,lat_max_us=100,lat_last_max_us=91,lat_total_max_us=412,jitter_us=1.2,seq_dropped=0i,seq_ooo=0i,seq_dup=0i,hist_80=397i,hist_90=3i 1791878400
trex_stream,class=L2,dc_pair=rzk-rzc,dscp=BE,dst_ap=C-L11,dst_dc=rzc,dst_vlan=1315,instance=trex-mon,kind=flowstat,name=L2_K-L11_C-L11_1315,pg_id=1012,profile=monitoring-default,src_ap=K-L11,src_dc=rzk,src_vlan=1315,tos=0x00,vrf=VPN-CORE tx_pkts=864020i,rx_pkts=864020i,drop_pkts=0i,drop_pkts_total=0i,tx_pps=100,rx_pps=100,tx_bps=105600,rx_bps=105600,rx_ok=true 1791878400
trex_port,instance=trex-mon,port=0,role=multiplexed tx_pps=10050,rx_pps=10049,tx_bps=10291200,rx_bps=10290176,ierrors=0i,oerrors=0i,tx_queue_full=0i,link_up=true 1791878400
trex_global,instance=trex-mon cpu_util=3.1,rx_cpu_util=12.5,active_streams=176i,unresolved_clients=0i,queue_full=0i,rx_drop_bps=0,exporter_lag_ms=35i 1791878400
trex_event,kind=annotation text="Maintenance: sw-rzk-L21 IRF member 2 reboot (CHG-1234)" 1791879000
Read the first point like this: at 08:00:00 UTC the latency stream pg_id 12 (L2 inter-DC, K-L11 to C-L11, VLAN 1314)
sent and received 200 packets per second and lost nothing; latency averaged 86.4 µs, all 400 packets of the interval
stayed below 100 µs (397 in the 80-89 µs bucket, 3 in the 90-99 µs bucket, so lat_max_us is the upper edge of that
bucket, 100 µs), and the worst value since the start was 412 µs. lat_last_max_us (91 µs) is TRex's maximum of the
last 0.5 s of the interval only - kept for reference. Tags are sorted alphabetically by key, as InfluxData
recommends for write performance.
Tags or fields?
The choice between tag and field is the most important schema decision, and it cannot be changed later without rewriting data.
Make it a tag when you filter or group by it and it takes a limited, stable set of values. Tags are indexed, so
filter(fn: (r) => r.src_ap == "K-L11") finds the series through the index instead of scanning values. All
descriptive attributes of a stream are tags: pg_id, class, src_ap, dst_ap, dc_pair, src_vlan, kind,
dscp and so on. Tag values are strings: pg_id is "12", src_vlan is "1314".
Make it a field when it is a measured value, when you calculate with it (mean, max, sum), or when it has many
different values. Fields are typed, so lat_avg_us can be averaged; tags, being strings, cannot.
Why it matters: a measured value stored as a tag creates a new series for every new value - latency as a tag
would create thousands of series per stream per day, the classic cause of high series cardinality, memory growth and
slow queries. An identifier stored as a field cannot be used efficiently for filtering and grouping. Free text belongs
in fields (the text of a trex_event is unique; its kind, with five values, is a tag). And keep one attribute per
tag: src_ap=K-L11 plus src_dc=rzk, not src=K-L11@rzk, which would force regular expressions into every query.
In the LVR platform
test_id in trex_test is a tag although it grows with every lab test - acceptable at a few hundred values per
year. Never tags: timestamps, sequence numbers, latency values, counters, anything that changes with every point.
Series and cardinality for LVR
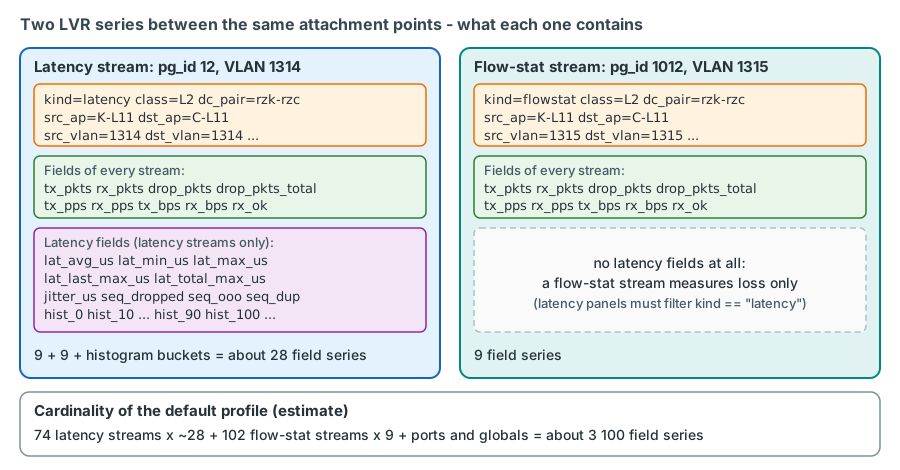
The default monitoring profile (see chapter 16) has 74 latency streams and 102
flow-stat streams. Every stream has 9 fields that all kinds share (counters, drops, packet and bit rates, rx_ok); a
latency stream adds 9 latency and sequence fields and, typically, around ten histogram buckets that ever receive
packets. Together:
| Source | Field series |
|---|---|
| 74 latency streams x ~28 fields | ~2 100 |
| 102 flow-stat streams x 9 fields | 918 |
| 8 ports x 8 fields, 2 instances x 8 fields | 80 |
trex_test, trex_event |
grows slowly with tests and events |
| Total | about 3 100 |
That is very small. High series cardinality - the usual cause of memory problems in InfluxDB - comes from tags with
unique, ever-changing values such as IDs or timestamps. For LVR it would only arise if a measured value became a tag,
or if stream tags changed on every re-apply (a timestamp in name, for example). Measure the real number with
validate on the bench:
import "influxdata/influxdb"

influxdb.cardinality(bucket: "trex", start: -1d)
Writing data
The write API
Points are written with an HTTP POST to /api/v2/write. Organisation, bucket and timestamp precision are query
parameters; the token is a header; the body is line protocol, any number of lines:
influx bucket create --org lvr --name scratch --retention 1h
curl --request POST "http://127.0.0.1:8086/api/v2/write?org=lvr&bucket=scratch&precision=s" \
  --header "Authorization: Token $INFLUX_TOKEN" \
  --header "Content-Type: text/plain; charset=utf-8" \
  --data-binary "trex_stream,class=L2,kind=latency,pg_id=12 lat_avg_us=86.4,rx_pps=200,drop_pkts=0i $(date +%s)"
The same with the CLI: influx write --org lvr --bucket scratch --precision s "<line protocol>".
verified against the InfluxDB OSS v2 write API and influx write documentation (one
hour is the minimum retention period). The response codes: 204 all points written; 400 malformed line
protocol, nothing written, the body names the first bad line; 401 token missing or without write permission;
422 some or all points rejected, for example a field type conflict or a timestamp outside the retention period;
503 temporarily unavailable, retry after Retry-After.
Precision, batching and duplicates
- Precision. The
precisionparameter (nsdefault,us,ms,s) must match the timestamps in the body: a seconds timestamp written with nanosecond precision lands in January 1970 and is rejected as outside the retention period. It must also be finer than the polling interval, or two polls could share one timestamp. - Batching. InfluxData recommends batches of up to about 5 000 lines. The exporter writes all points of one poll - about 180 lines - in one request every 2 seconds.
- Duplicates. A point is identified by measurement, tag set and timestamp. Writing the same identity again merges the field sets and the new value wins. Retries are therefore harmless, and the downsampling task (below) may process overlapping time ranges.
- Clock. Timestamps come from the writing host. The TRex server must be synchronised with NTP.
What the exporter does
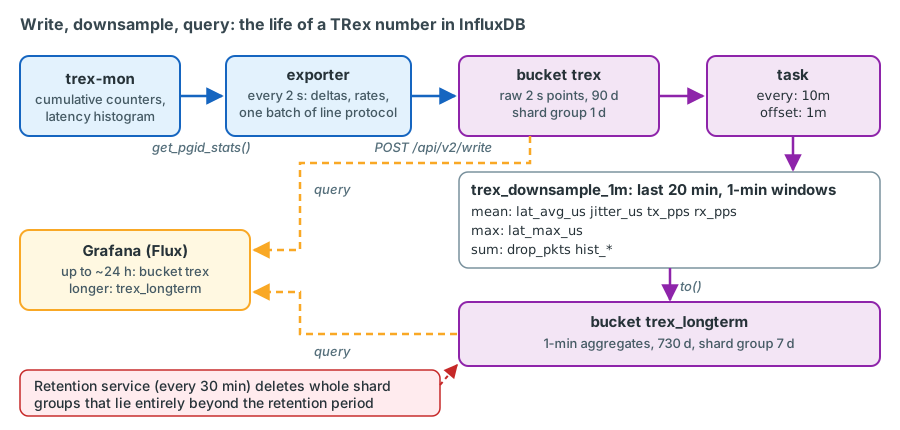
The exporter of the planned orchestrator trexctl (chapter 18) polls the monitoring
instance every 2 seconds (get_pgid_stats(), get_stats()), turns cumulative counters into interval values, adds the
stream tags and writes the batch with its write-only token; if InfluxDB is unavailable it buffers up to 10 minutes in
memory. Until trexctl exists, a small Python script using the TRex STLClient API and the InfluxDB Python client can
do the same job. Such a script only reads: it never acquires the trex-mon ports, and it ends with
disconnect(stop_traffic=False), because disconnect() by default stops the traffic on every port the client owns.
Reading is not the exporter's only job, though: a supervisor thread watches for a restart of trex-mon - the
server uptime resets, or active_streams falls to zero while a profile is recorded as active in
/data/trexctl/state/ - and, once the server accepts connections again, runs trexctl apply -p <active profile> and
restarts the gateway-MAC tracker, so the monitoring comes back without manual intervention.
Integers stay integers, floats stay floats
InfluxDB fixes the type of a field per shard with the first value written. If the exporter once writes
lat_avg_us=0i (an integer, for example because TRex returned 0 instead of 0.0) after lat_avg_us=86.4, the
point is rejected with status 422 ("field type conflict") and the interval is missing. Exporters must cast
explicitly: float() for rates and latencies, int() for counters.
Querying with Flux
Flux is a functional language: data flows from a source through a chain of functions connected by the pipe-forward
operator |>. Each function receives a stream of tables and returns a stream of tables. You can run Flux in the
Data Explorer of the InfluxDB UI, with influx query --file query.flux on the server, or in Grafana (chapter 9). In
Grafana you replace fixed times by the dashboard's time range, v.timeRangeStart and v.timeRangeStop. The queries
in this section use only functions of the Flux standard library; validate on the bench
each one against real data before you build on it.
Step by step: the latency of one stream
from(bucket: "trex")
  |> range(start: -1h)
  |> filter(fn: (r) => r._measurement == "trex_stream")
  |> filter(fn: (r) => r.kind == "latency" and r.class == "L2")
  |> filter(fn: (r) => r.src_ap == "K-L11" and r.dst_ap == "C-L11" and r.src_vlan == "1314")
  |> filter(fn: (r) => r._field == "lat_avg_us")
  |> aggregateWindow(every: 1m, fn: mean, createEmpty: false)
from()selects the bucket.range()selects the time and is mandatory - Flux refuses unbounded queries.startis inclusive,stopexclusive and defaults tonow();-1his relative tonow(). It adds_startand_stopto every table and to the group key.filter()keeps the rows for which the predicate is true. Filter on measurement, tags and field as early as possible; tag filters are answered from the index. Afterwards there is one table: thelat_avg_usvalues of stream 12, 1 800 rows for one hour.aggregateWindow()cuts each table into windows ofeveryand appliesfnto each. The result gets the window's stop time (timeSrc: "_stop"); empty windows produce null rows unlesscreateEmpty: falseis set.
The aggregate must match the meaning of the field. mean, sum and count compute new values; max, min,
first and last are selectors that return an existing row:
| Field | Aggregate | Why |
|---|---|---|
lat_avg_us, jitter_us, tx_pps, rx_pps |
mean |
Typical value in the window |
lat_max_us |
max |
The worst packet in the window must stay visible |
drop_pkts, hist_* |
sum |
Packets per window add up |
tx_pkts, rx_pkts, drop_pkts_total |
last (or difference) |
Cumulative counters: summing readings is meaningless |
yield() returns several results from one query. To show average and interval maximum of the same stream, define
the data once and branch; each result needs its own name:
data = from(bucket: "trex")
  |> range(start: -1h)
  |> filter(fn: (r) => r._measurement == "trex_stream" and r.kind == "latency")
  |> filter(fn: (r) => r.class == "L2" and r.src_ap == "K-L11" and r.dst_ap == "C-L11" and r.src_vlan == "1314")

data
  |> filter(fn: (r) => r._field == "lat_avg_us")
  |> aggregateWindow(every: 1m, fn: mean, createEmpty: false)
  |> yield(name: "avg")

data
  |> filter(fn: (r) => r._field == "lat_max_us")
  |> aggregateWindow(every: 1m, fn: max, createEmpty: false)
  |> yield(name: "max")
group(): drops per minute per DC pair
After filtering, every stream is its own table. group() changes the group key and therefore which rows end up in
the same table. To see the lost packets per minute for each DC pair, put all streams of a pair into one table, then
sum per minute:
from(bucket: "trex")
  |> range(start: -6h)
  |> filter(fn: (r) => r._measurement == "trex_stream" and r._field == "drop_pkts")
  |> group(columns: ["dc_pair"])
  |> aggregateWindow(every: 1m, fn: sum, createEmpty: false)
The result has one table per dc_pair value (rzk-rzk, rzk-rzc, rzc-rzc, x-fw). group() with an empty column
list merges everything into one table; group() does not guarantee sort order, so add sort() when order matters.
pivot() and map(): the outage table
During a maintenance window you want to know, per stream, how long it was interrupted. Outage duration is lost
packets divided by the packet rate. Both values are fields of the same point, so they can be put side by side with
pivot() and combined with map():
from(bucket: "trex")
  |> range(start: 2026-10-13T20:00:00Z, stop: 2026-10-13T22:00:00Z)
  |> filter(fn: (r) => r._measurement == "trex_stream")
  |> filter(fn: (r) => r._field == "drop_pkts" or r._field == "tx_pps")
  |> pivot(rowKey: ["_time"], columnKey: ["_field"], valueColumn: "_value")
  |> map(fn: (r) => ({r with outage_s: if r.tx_pps > 0.0 then float(v: r.drop_pkts) / r.tx_pps else 0.0}))
  |> group(columns: ["name", "class", "src_ap", "dst_ap"])
  |> sum(column: "outage_s")
  |> group()
  |> sort(columns: ["outage_s"], desc: true)
pivot()turns the values of_fieldinto columns: each row now has_time, the tags,drop_pktsandtx_pps. Because_fieldwas in the group key and is now a column name, the two per-field tables of a stream merge into one.map()computes a new column for every row.drop_pktsis an integer andtx_ppsa float, sofloat(v: ...)converts before dividing - Flux does not mix types implicitly.- Computing the outage per 2-second interval keeps the result correct even when a stream's rate was changed in the window, for example raised to 1 000 pps for a convergence measurement.
sum(column: "outage_s")adds up the intervals per stream; the finalgroup()andsort()produce one table ordered from the longest to the shortest outage.
join.inner(): combining two queries
Sometimes the values come from two different queries. The same outage table can be built from a sum of lost packets
and a mean rate per stream. Flux's old join() function is deprecated; use the join package:
import "join"

drops = from(bucket: "trex")
  |> range(start: 2026-10-13T20:00:00Z, stop: 2026-10-13T22:00:00Z)
  |> filter(fn: (r) => r._measurement == "trex_stream" and r._field == "drop_pkts")
  |> group(columns: ["name", "class", "src_ap", "dst_ap"])
  |> sum()

pps = from(bucket: "trex")
  |> range(start: 2026-10-13T20:00:00Z, stop: 2026-10-13T22:00:00Z)
  |> filter(fn: (r) => r._measurement == "trex_stream" and r._field == "tx_pps")
  |> group(columns: ["name", "class", "src_ap", "dst_ap"])
  |> mean()

join.inner(
    left: drops,
    right: pps,
    on: (l, r) => l.name == r.name,
    as: (l, r) => ({l with drops: l._value, pps: r._value, outage_s: float(v: l._value) / r._value}),
)
  |> group()
  |> sort(columns: ["outage_s"], desc: true)
The functions of the join package only compare tables whose group keys match, so both inputs are grouped by the
same columns first - otherwise _field, different in the two inputs, would keep the tables apart and the join would
return nothing. This version assumes a constant rate in the window; the pivot() version does not.
InfluxQL
InfluxDB 2.x also understands InfluxQL, the SQL-like language of 1.x, through its 1.x compatibility API once a bucket
is mapped to a "database and retention policy" (influx v1 dbrp create). The platform uses Flux for joins, pivots
and tasks; a future move to InfluxDB 3 would mean rewriting the queries in InfluxQL or SQL.
Tasks: downsampling into trex_longterm
A task is a Flux script that InfluxDB runs on a schedule. Its options are declared in the script itself:
| Option | Meaning |
|---|---|
name |
Name of the task (required) |
every |
Interval between runs. Runs are aligned: a task with every: 1h saved at 14:30 first runs at 15:00 |
cron |
Alternative to every: a cron expression |
offset |
Delays the execution but keeps the time range: all relative times in the script refer to the scheduled time, not the delayed execution time |
The LVR downsampling task turns 2-second raw data into 1-minute aggregates for long-term trends:
option task = {name: "trex_downsample_1m", every: 10m, offset: 1m}

src = from(bucket: "trex")
  |> range(start: -20m)
  |> filter(fn: (r) => r._measurement == "trex_stream")

src
  |> filter(fn: (r) => r._field == "lat_avg_us" or r._field == "jitter_us" or r._field == "tx_pps" or r._field == "rx_pps")
  |> aggregateWindow(every: 1m, fn: mean, createEmpty: false)
  |> to(bucket: "trex_longterm", org: "lvr")
  |> yield(name: "mean")

src
  |> filter(fn: (r) => r._field == "lat_max_us")
  |> aggregateWindow(every: 1m, fn: max, createEmpty: false)
  |> to(bucket: "trex_longterm", org: "lvr")
  |> yield(name: "max")

src
  |> filter(fn: (r) => r._field == "drop_pkts" or r._field =~ /^hist_/)
  |> aggregateWindow(every: 1m, fn: sum, createEmpty: false)
  |> to(bucket: "trex_longterm", org: "lvr")
  |> yield(name: "sum")
validate on the bench functions and options checked against the Flux and task documentation; run it once against real data before relying on it.
How it works and why it is built this way:
- Every 10 minutes, the last 20 minutes. Every minute is processed twice, so a failed run or late data is repaired by the next run. The second run writes identical measurement, tags and timestamps, which overwrite.
- Offset 1 minute. The run scheduled for 10:10:00 executes at 10:11:00 but still covers 09:50:00-10:10:00, so the last minute is complete. Runs are aligned to the 10-minute grid, so the windows are whole minutes.
- The right aggregate per field. Means for typical values, maximum for the interval maximum, sums for per-interval
counts. Cumulative counters, lifetime values (
lat_total_max_us,lat_min_us) and sequence counters are not copied - the interval fields show long-term behaviour better. Neither is the reference valuelat_last_max_us: the 1-minute maximum oflat_max_usalready covers every packet of the minute. to()writes the result. It needs_time,_measurement,_fieldand_valueand writes all other string columns as tags, so long-term points keep the stream tags and field names. Intrex_longtermthe same names have a 1-minute meaning:drop_pktsis lost packets per minute,lat_max_usthe worst value of the minute.- Explicit yields. Each branch ends in its own named
yield(), so the script has three distinct results.
influx task create --org lvr --file /opt/trexctl/influx/downsample.flux
influx task list --org lvr
influx task log list --task-id <task-ID>
influx task retry-failed --id <task-ID>
verified flags from the influx CLI reference (task create, task list, task log list,
task retry-failed).
Operations
Health and logs
systemctl status influxdb and journalctl -u influxdb show service state and log; influx ping checks the
/health endpoint without a token; curl -s http://127.0.0.1:8086/metrics returns internal write and query metrics
in Prometheus format when InfluxDB seems slow.
Disk usage
InfluxData's sizing guide for the TSM engine gives about 3 bytes per stored non-string value as a planning figure.
The exporter writes roughly 1 500 values per second (about 130 million per day), so trex needs at most about 400 MB
per day, about 35 GB for 90 days; trex_longterm stays below 5 GB for two years. Real usage is usually lower because
regular timestamps and slowly changing values compress well. Check after the first week with
du -sh /data/influxdb/engine and watch the free space of /data.
Backup and restore
verified syntax influx backup <path> -t <token> from the InfluxDB OSS v2 Back up data
documentation.
influx backupcopies data and metadata of the whole instance and needs the operator token;--bucket <name>limits it to one bucket. Copy the directory to the LVR backup target; keep about 14 days locally.influx restore <dir> --bucket trex --new-bucket trex_restoredrestores one bucket under a new name (restoring into an existing bucket is not possible) - the safe way to look at old data next to live data.influx restore <dir> --full --operator-token <token>replaces all data and metadata - disaster recovery only.- Grafana is not included;
grafana.dbis backed up separately (chapter 9). Test a restore once after installation.
Upgrades within 2.x
Minor upgrades are in place: back up, read the release notes, install the new influxdb2 package, restart, then check
influx ping, the dashboards and the task log. Release notes matter - 2.9.0, for example, hashed all stored tokens.
Lock the installed version (for example with dnf versionlock) so that upgrades only happen deliberately.
Pitfalls
UTC timestamps. InfluxDB stores Unix time (UTC); Grafana shows the browser's time zone, so 08:00:00Z appears as
10:00 in Germany in summer and 09:00 in winter. Absolute Flux times are RFC 3339 with Z. When matching a dashboard
event to a switch log, check the log's time zone.
Counters versus interval values. tx_pkts, rx_pkts and drop_pkts_total are cumulative: summing them is
meaningless, and they restart from zero when the TRex instance restarts. Use the interval fields (drop_pkts with
sum), or difference(nonNegative: true) or increase() on a counter, which handle the reset.
Missing data is not zero. If the exporter stops, no points are written and the dashboard shows a gap. If a path
breaks, the exporter keeps writing rx_pps=0 and drop_pkts>0. Do not hide gaps with createEmpty: true plus
fill(value: 0): that turns "we know nothing" into "everything is fine".
Frozen latency values. When no packet of a latency stream arrives, TRex has nothing to measure and keeps the last
average. An exporter that kept copying it would draw a normal-looking latency line for a dead path. The LVR exporter
therefore writes no latency fields for intervals without received packets: during an outage the latency fields show a
gap while rx_pps drops to 0. Read latency together with rx_pps.
High cardinality and wrong types. Never put a per-point value into a tag or let a re-apply invent new tag values
for the same stream (check with influxdb.cardinality()). Never change a field's type (status 422, see above).
Query time ranges. Every query needs range(), and stop is exclusive. A 90-day query on raw data reads millions
of points per stream - use trex_longterm for long ranges. In tasks, now() is the scheduled time.
Key takeaways
- InfluxDB 2.x is one process,
influxd: HTTP API, TSM storage engine (WAL, cache, index), BoltDB metadata, Flux engine, task scheduler, retention service. Ontrex-rzk-01it listens only on 127.0.0.1:8086. - Bucket
trexkeeps raw 2-second points for 90 days,trex_longterm1-minute aggregates for 730 days; retention deletes whole shard groups. - The exporter can only write
trex, Grafana can only read; tokens are shown once (hashed since 2.9.0); backups need the operator token. - A point is measurement + tags + fields + timestamp. Tags (indexed strings) identify the stream, fields (typed) carry measurements. About 3 100 series - trivial.
- Only latency streams (
kind=latency) have latency fields, and only for intervals with received packets.lat_max_usis the interval maximum from histogram deltas (upper edge of the highest bucket that grew),hist_*are per-interval counts,lat_total_max_usonly grows,lat_avg_usis a filtered recent average, andlat_last_max_us(TRexlast_max, last 0.5 s only) is kept for reference, never as the interval maximum. - Flux is a chain
from-range-filter- aggregate - reshape. Pickmean,maxorsumby meaning, and keep track of the group key. - The downsampling task re-processes 20 minutes every 10 minutes; duplicates overwrite, so the overlap is safe.
- Watch for UTC versus local time, counters versus deltas, gaps versus zeros, and integer versus float fields.
Check your understanding
1. A colleague proposes storing the measured latency as a tag so that it can be filtered quickly. What happens?
Every distinct latency value becomes part of a series key, so every stream creates new series continuously - a
cardinality explosion that drives memory use and slows queries. In addition, tag values are strings, so they
cannot be averaged or compared numerically. Latency is a measured value and must be a field; filter on tags such
as src_ap or class and then on the field value.
2. Why does the downsampling task query 20 minutes of data although it runs every 10 minutes - does that not create duplicates in trex_longterm?
The overlap makes the task self-healing: if a run fails or data arrives late, the next run processes the same minutes again. It creates no duplicates because InfluxDB identifies a point by measurement, tag set and timestamp; the second run writes exactly the same identities and overwrites the values.
3. A Latency matrix panel for VLAN 1315 stays empty, while the Loss panels for VLAN 1315 show data. Is something broken?
No. In the default profile the VLAN 1315 streams are flow-stat streams (kind=flowstat). They measure loss
only, so their points have no latency fields at all. Latency exists only for latency streams, which run in VLAN
1314 and in the routed and firewall classes.
4. You sum drop_pkts_total over one hour and get 1.8 million for a stream that lost 4 packets. What went wrong?
drop_pkts_total is a cumulative counter: every 2-second point repeats the running total, so summing 1 800
points multiplies it. Use sum on the interval field drop_pkts, or take last() minus first() (or
difference(nonNegative: true)) of the cumulative counter.
5. Why is lat_max_us not simply TRex's last_max value read every 2 seconds?
last_max covers only the last 0.5-second sampling window. Reading it every 2 seconds sees one window in four,
so most spikes would be missed. The exporter instead subtracts the previous histogram counts from the current
ones: the upper edge of the highest bucket that received packets in the interval is reported as the interval
maximum, with bucket resolution. TRex's last_max is still stored, as lat_last_max_us, but only for reference.
6. Data from 91 days ago is still visible in bucket trex although the retention period is 90 days. Is retention broken?
Probably not. Retention deletes whole shard groups, and only when the complete shard group (1 day for trex)
lies beyond 90 days; the service also runs only every 30 minutes. Data can therefore survive up to about 91 days
plus the check interval. Clearly older data would indicate a problem - check influx bucket list and the log.
7. After restoring a backup with --full you cannot authenticate any more. Which step was missing?
Backups from InfluxDB 2.9 contain only hashed tokens, so the CLI cannot use the restored operator token. A full
restore must be run with --operator-token <token> (influx CLI 2.8.0 or later), using the operator token kept in
the password safe.
References
- InfluxDB OSS v2 documentation, https://docs.influxdata.com/influxdb/v2/ - Line protocol, Data elements,
Schema design, Handle duplicate points, Resolve high cardinality, Optimize writes, Storage engine,
File system layout, Data retention, Shards and shard groups, Metrics, Configuration options
(
bolt-path,engine-path,sqlite-path,http-bind-address,query-memory-bytes,storage-cache-max-memory-size,use-hashed-tokens). - InfluxDB OSS v2 Release notes v2.9.0 (token hashing,
--operator-token, Flux v0.200.0) and v2.9.1 (GitHub release dated 2026-05-12); Manage API tokens; Back up data; Restore data; Write data with the InfluxDB API; Troubleshoot issues writing data; Task configuration options; Downsample data; Query with InfluxQL. - influx CLI reference -
setup,bucket create,auth create,write,query,task create/list/log list/retry-failed,backup,restore,ping,v1 dbrp create. - Flux standard library, https://docs.influxdata.com/flux/v0/stdlib/ -
range(),filter(),aggregateWindow(),group(),pivot(),map(),sum(),sort(),yield(),to(),join()(deprecated),join.inner(),difference(),increase(),fill(),influxdb.cardinality(); Troubleshoot join operations; The future of Flux. - InfluxDB v1 Hardware sizing guidelines, section "Bytes and compression".
- InfluxData package repository https://repos.influxdata.com/stable/x86_64/main/ (package names).
- TRex Stateless Python API,
get_pgid_stats()(local copystl_client_api.txt); trex-core sourcesrc/time_histogram.cppandsrc/time_histogram.h(histogram buckets, low-pass average, frozen values). - Plan document v0.92 (14 October 2026), sections 9.5 (gateway-MAC tracker, step 6; apply and port release, step 7), 9.7, 9.10 (supervisor thread), 10.1, 10.2 and 10.6.