4. Stateless traffic (STL)
In this chapter
You will learn
- how TRex organises stateless traffic: instance, port, profile, stream, packet template, mode and rate
- how to build the LVR monitoring frame with Scapy, byte by byte, and why every field has its value
- how to choose a transmission mode and convert between pps, L1/L2 bit/s and percent of line rate
- when the field engine is needed and how to vary packet fields without running Python per packet
- how to write a profile file with tunables that works from the console and from Python
- which port attributes and modes matter: promiscuous mode, L2/L3 mode, service mode, ping and capture
- how to drive both LVR instances from the console and from Python without disturbing production
Everything the LVR platform measures permanently is stateless traffic: about 176 unidirectional UDP streams that leave the TRex server double-tagged, cross the fabric and come back. Each stream is a packet template that the data-plane cores replay at a fixed rate, plus a few bytes of bookkeeping that let TRex count and time every packet. If you can read a stream definition, you can explain every line in Grafana; if you can write one, you can run any ad-hoc test the network team asks for. How TRex counts the packets and measures their latency follows in chapter 5.
The STL object model
From instance to stream
A stateless TRex instance (chapter 3) owns a set of ports and lets clients load traffic onto them:
- Port - one physical NIC port, numbered in the order of the
interfaceslist of the instance's configuration file (the first entry is port 0). Each LVR instance numbers its own ports from 0. - Profile - a set of streams attached to one port. Without a name the default profile
_is used. Since v2.57 several profiles can run side by side on one port, addressed asport.profile(for example0.adhoc). - Stream - one unidirectional packet flow: a packet template built with Scapy, an optional field-engine program, a transmission mode, a rate, an optional statistics object and optional chaining to other streams.
- pg_id - the packet-group ID inside the statistics object (
STLFlowStatsorSTLFlowLatencyStats), a 32-bit number you choose. TRex reports packets, bytes and latency under this key.
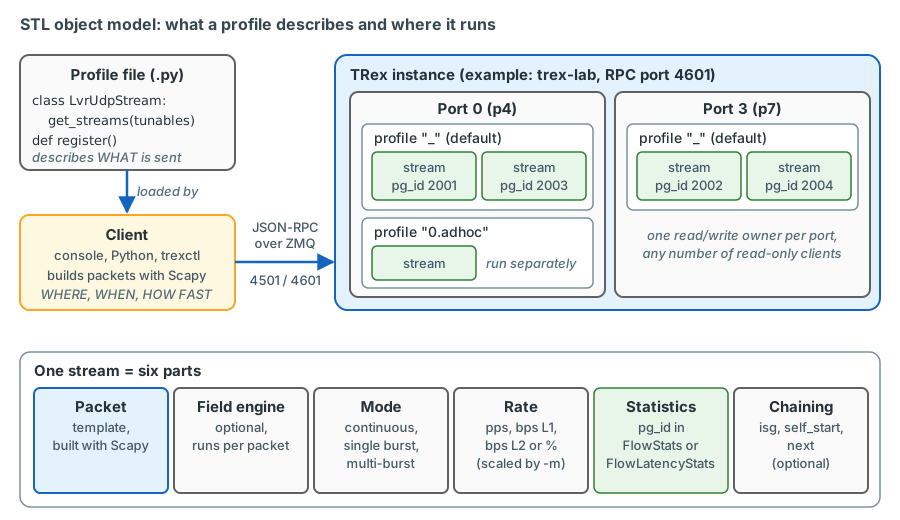
When you start a profile, the client imports the file and calls its get_streams() function once. Scapy builds each
packet template, the client compiles it to bytes and sends stream, mode, rate and statistics as JSON over the ZMQ RPC
channel (port 4501 on trex-mon, 4601 on trex-lab). The server's data-plane cores then replay the templates on
schedule. No Python runs per packet - that is why one core can send millions of packets per second, and why anything
that changes from packet to packet must be expressed as field-engine instructions.
Why is the profile separate from the control?
A profile answers what is sent. Where (port), when (start, stop, duration) and how fast (the multiplier) are
decided by whoever loads it. The same file therefore runs unchanged in the console, in a Python script, in the
offline simulator stl-sim and later in trexctl - a stream that misbehaves in Grafana can be reproduced by hand with
exactly the same packet.
TRex is multi-user, but each port has at most one read/write owner; any number of read-only clients may watch. A client acquires ports before it can change them, and acquiring a port owned by someone else fails unless it is forced. This matters on trex-mon, see Working from the console.
Building packets with Scapy
Scapy describes a packet as a stack of layer objects joined with /. Fields you do not set get defaults; lengths,
EtherTypes and checksums are computed when the packet is built. len(pkt) returns the size without the Ethernet FCS,
which the NIC appends on transmission. Profiles pad a packet to the wanted size by appending a byte string.
The LVR monitoring frame
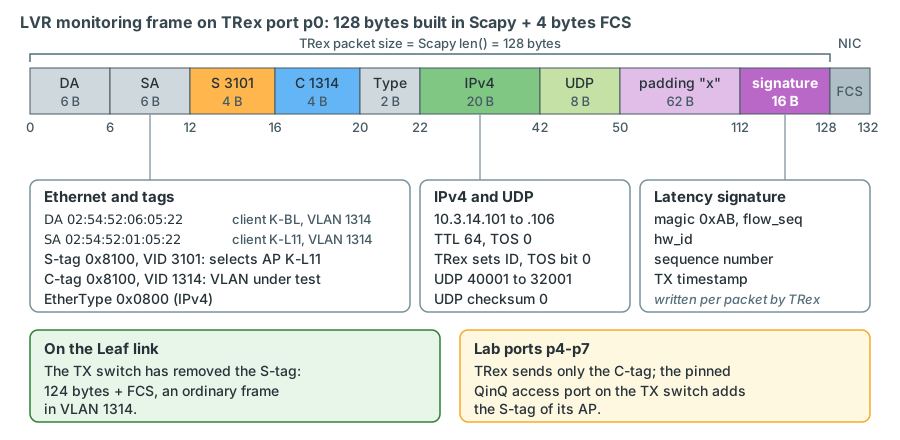
The default monitoring stream is a 128-byte (without FCS), double-tagged IPv4/UDP frame. The example is the L2 stream from the client at AP K-L11 to the client at AP K-BL in VLAN 1314, sent from trex-mon port p0:
from trex.stl.api import *   # STL classes plus the Scapy layers (Ether, Dot1Q, IP, UDP, ...)

base = (Ether(src="02:54:52:01:05:22",       # (1)!
              dst="02:54:52:06:05:22") /     # (2)!
        Dot1Q(vlan=3101) /                   # (3)!
        Dot1Q(vlan=1314) /                   # (4)!
        IP(src="10.3.14.101", dst="10.3.14.106", ttl=64, tos=0) /   # (5)!
        UDP(sport=40001, dport=32001, chksum=0))                    # (6)!
pad = max(0, 128 - len(base)) * "x"          # (7)!
pkt = base / pad                             # 128 bytes; the NIC adds 4 bytes FCS
- Source = the TRex client of AP K-L11 (AP index 1) in VLAN 1314 (0x0522):
02:54:52:<AP index>:<VLAN high>:<VLAN low>.02marks a locally administered unicast address;54:52is ASCII "TR". - Destination = the client of AP K-BL (index 6) in the same VLAN. Class L2 targets the remote TRex client; routed classes target the gateway MAC (resolved by EMU, chapter 6).
- Outer tag (S-tag, TPID 0x8100), S-VLAN 3101. On
sw-rzk-TX1this S-VLAN contains only the AP port towards sw-rzk-L11 and the TRex trunks, so it selects the attachment point. - Inner tag (C-tag) = the production VLAN under test. The TX switch removes the S-tag; the Leaf sees a normal frame in VLAN 1314.
- Deterministic addresses: pool start 10.3.14.101 + (AP index - 1). TTL 64; TOS 0. The DSCP class uses 0x00 (BE, the reference), 0xB8 (EF), 0x88 (AF41) and 0x20 (CS1). TRex sets bit 0 of the TOS byte on statistics streams, so 0x00 leaves as 0x01 and 0xB8 as 0xB9 - the DSCP is unchanged (chapter 5).
- Source port 40000 + stream index (stable per stream), destination port 32000 + class (32001 = L2).
chksum=0means "no UDP checksum", legal for IPv4 - see The field engine for the reason. - 50 bytes of headers + 78 bytes of padding. For latency streams TRex overwrites the last 16 bytes (chapter 5).
The first 50 bytes of this template, computed with Scapy 2.8 (hexdump(pkt)) verified with
Scapy:
0000  02 54 52 06 05 22 02 54 52 01 05 22 81 00 0c 1d
0010  81 00 05 22 08 00 45 00 00 6a 00 01 00 00 40 11
0020  49 ae 0a 03 0e 65 0a 03 0e 6a 9c 41 7d 01 00 56
0030  00 00
Read it as: destination and source MAC; S-tag 81 00 0c 1d (TPID 0x8100, VID 0xc1d = 3101); C-tag 81 00 05 22
(VID 1314); EtherType 08 00; the IPv4 header from offset 22 (total length 0x006a = 106, TTL 0x40 = 64, protocol 0x11
= UDP, 10.3.14.101 to 10.3.14.106); the UDP header from offset 42 (ports 0x9c41 = 40001 and 0x7d01 = 32001, length
0x56 = 86, checksum 0). The payload starts at offset 50.
This is the template. On the wire two header fields of every statistics stream differ: TRex replaces the IPv4
identification (here Scapy's default 00 01) with a value from its reserved range - 0xFFFF for every latency stream -
and sets bit 0 of the TOS byte; it adjusts the IPv4 header checksum accordingly (chapter 5).
In the LVR platform
On the Leaf link the same frame is 124 bytes, because the TX switch pops the S-tag (chapter 12). On the way back the
Leaf sends it single-tagged into the AP port, the TX switch pushes the S-tag of that AP (3110 for K-BL) and
delivers it double-tagged to a TRex trunk: TRex receives S 3110 / C 1314 for a stream it sent as
S 3101 / C 1314.
The lab variant. The lab ports p4-p7 are QinQ access ports, each pinned to one AP; the TX switch adds the S-tag
itself. A lab stream therefore carries only the C-tag (Ether()/Dot1Q(vlan=1314)/IP()/UDP()), padded to the same
size. A lab client's IP follows the pinned AP - lab pool start .151 + (AP index - 1), i.e. AP index + 50 relative to the
monitoring pool - while its MAC is the fixed MAC of the lab port (src_mac in the TRex configuration), because TRex
answers ARP for a lab port with the port MAC and the pin changes over time: p4 behind K-L11 02:54:52:f0:00:04 /
10.3.14.151, p7 behind C-L21 (index 10) 02:54:52:f0:00:07 / 10.3.14.160.
The TRex example addresses 16.0.0.0 and 48.0.0.0
Almost every TRex example builds its packets with IP(src="16.0.0.1", dst="48.0.0.1"), and the stateful examples take
their clients from 16.0.0.0 and their servers from 48.0.0.0 (for example ASTFIPGenDist(ip_range=["16.0.0.0",
"16.0.0.255"]) and ["48.0.0.0", "48.0.255.255"] in the ASTF guide). The ranges belong to the bench set-up that TRex
was built for: one device under test (DUT) between two TRex ports, with an emulated client network behind one port and
an emulated server network behind the other.
           client network                                server network
           16.0.0.0/8                                    48.0.0.0/8
TRex port 0 ───────────────►  router / firewall (DUT)  ───────────────► TRex port 1
            ◄───────────────                           ◄───────────────
The DUT learns where the two emulated networks are from two static routes, each pointing back to the TRex port that "owns" the range. The stateless guide's first tutorial shows them from TRex docs (section 2.7.2, "Static route"):
ip route 16.0.0.0 255.0.0.0 1.1.9.2      ! clients: next hop = the TRex port on the 1.1.9.0/24 link
ip route 48.0.0.0 255.0.0.0 1.1.10.2     ! servers: next hop = the TRex port on the 1.1.10.0/24 link
Whole ranges instead of single addresses matter for the stateful modes, where every flow gets its own client address and
port, so the DUT sees thousands of different sessions. The legacy stateful mode even moves each further port pair to
its own ranges - dual_port_mask: "1.0.0.0" gives ports 2/3 the ranges 17.x/49.x, ports 4/5 18.x/50.x - "to make static
route configuration per port possible" (TRex manual, section 4.11 "Clients/Servers IP allocation scheme").
The documentation does not say why 16 and 48 were chosen. They are not private addresses: the ARIN registry lists 16.0.0.0-16.2.255.255 for Hewlett Packard Enterprise and 48.0.0.0-48.43.255.255 for Prudential Insurance (lookup of October 2026). On an isolated bench that does not matter, because no packet leaves the lab.
Why the LVR streams use real addresses instead
In the LVR platform there is no bench DUT that can be told "16.0.0.0/8 lives behind TRex port 0". The device under test is the production network - fabric, Border Leaf gateways and firewalls - and it routes with its real tables:
- Routed streams would get lost.
sw-rzk-BLhas no route to 48.0.0.1, so it follows the VPN-CORE default route to the Enterprise firewall, which at best drops the packet. A reverse stream to 16.0.0.1 has no route either. Every L3-BL, L3-DCFW and L3-ENTFW stream would show 100 % loss. - Making them work would hijack real address space. It would take static routes for 16.0.0.0/8 and 48.0.0.0/8
on the Border Leafs. OSPF 1 of VPN-CORE redistributes static routes (
import-route static), so every LVR host that tries to reach a real address in those ranges would be sent to TRex instead. - L2 streams would pass - switches do not look at IP addresses inside a VLAN - but they would place hosts with foreign addresses into production VLANs, which confuses everyone who later reads the MAC tables or firewall logs.
The TRex clients are therefore ordinary hosts of the networks they test, with addresses from reserved pools: 10.3.14.101-116 in VLAN 1314 (one address per AP, so the address tells you the AP), .151-.166 for the lab clients, 10.9.90.0/24 in the firewall zone. The LVR counterpart of 16.0.0.0/48.0.0.0 is the stateful test with routed ranges: clients 10.9.92.0/24 and servers 10.9.93.0/24 - private, unused, approved by IPAM, and routed by two temporary static routes (chapter 7).
Two examples in this course still use 16.0.0.1 → 48.0.0.1: the console and Python session in chapter 2 and the self-tests in chapter 17. Both run over a DAC that connects two TRex ports directly - with no switch or router in the path, any address works.
Transmission modes
| Mode | Behaviour | Typical LVR use |
|---|---|---|
STLTXCont |
sends until stopped, or until the duration given to start expires |
all permanent monitoring streams |
STLTXSingleBurst |
sends exactly total_pkts packets, then the stream ends |
"send 10 000 packets and count them" checks |
STLTXMultiBurst |
sends count bursts of pkts_per_burst packets with an inter-burst gap ibg in microseconds |
buffer and microburst tests in the lab |
STLTXCont(pps=200)
STLTXSingleBurst(total_pkts=10000, pps=1000)
STLTXMultiBurst(pkts_per_burst=4, ibg=1000000.0, count=5, pps=1000)
Without a rate a stream sends 1 pps. isg (inter-stream gap, microseconds) delays the first packet;
self_start=False plus next="name" chains burst streams so that one starts when the previous one ends (a continuous
stream never ends and cannot have a next).
Rates, frame sizes and the multiplier
What is counted as a byte
A mode accepts exactly one of pps, bps_L1, bps_L2 or percentage (of the port's line rate); TRex converts between
them using the packet size. Three sizes matter, and mixing them up is the most common source of "wrong" bandwidth:
| Size | LVR frame | Used by |
|---|---|---|
TRex packet size (Scapy len()) |
128 B | profiles, tunables such as --size |
| L2 size = packet + FCS | 132 B | TRex "bps L2", multiplier unit mbps, flow-stat byte counters, "length" column of the streams table |
| L1 size = L2 + preamble/SFD (8) + inter-frame gap (12) | 152 B | TRex "bps L1", percent of line rate |
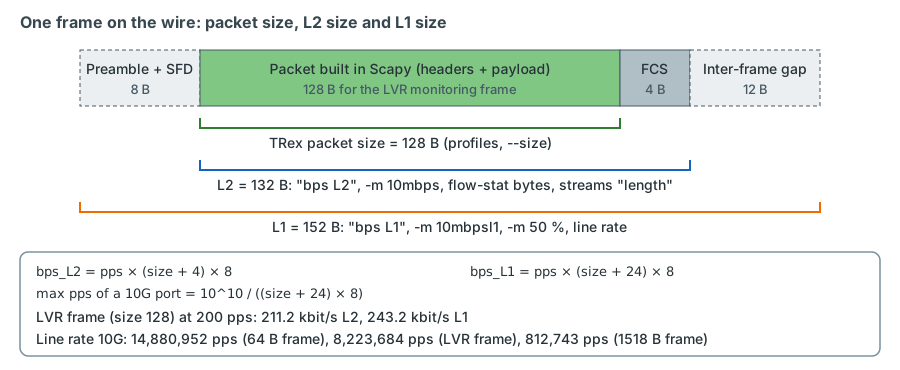
With size = TRex packet size: bps_L2 = pps × (size + 4) × 8, bps_L1 = pps × (size + 24) × 8, percent of a 10G
port = bps_L1 / 10^10 × 100, and the maximum packet rate of a 10G port is 10^10 / ((size + 24) × 8). A "64-byte
frame" in an RFC 2544 report includes the FCS, so TRex builds 60 bytes (the official examples compute
size = self.fsize - 4 # no FCS).
| Example | Calculation | Result |
|---|---|---|
| Fabric latency stream, 128 B at 200 pps | 200 × 132 × 8 and 200 × 152 × 8 | 211.2 kbit/s L2, 243.2 kbit/s L1 |
| Loss-only stream, 128 B at 100 pps | 100 × 132 × 8 and 100 × 152 × 8 | 105.6 kbit/s L2, 121.6 kbit/s L1 |
| Firewall stream, 128 B at 50 pps | 50 × 132 × 8 and 50 × 152 × 8 | 52.8 kbit/s L2, 60.8 kbit/s L1 |
| Whole trex-mon budget: 19 400 pps of 128 B + 1 200 pps of 256 B (chapter 16) | sum of the above | about 23.0 Mbit/s L2 (22.3 Mbit/s without FCS), 26.3 Mbit/s L1 - about 0.13 % of two 10G ports |
-m 10mbps with 128-byte packets |
10 000 000 / (132 × 8) | 9 470 pps |
| Frame with FCS (report convention) | TRex size | L1 bytes | Line rate of one 10G port | L2 throughput |
|---|---|---|---|---|
| 64 B | 60 | 84 | 10^10 / 672 = 14,880,952 pps | 7.62 Gbit/s |
| 132 B (LVR monitoring frame) | 128 | 152 | 8,223,684 pps | 8.68 Gbit/s |
| 512 B | 508 | 532 | 2,349,624 pps | 9.62 Gbit/s |
| 1518 B | 1514 | 1538 | 10^10 / 12 304 = 812,743 pps (812,743.8) | 9.87 Gbit/s |
The multiplier
The rates in a profile are a shape; the multiplier scales the whole profile on a port at start time (-m in the
console, mult= in Python). Forms accepted by the v3.08 console parser:
| Form | Example | Meaning |
|---|---|---|
| plain number | -m 2 |
factor: every stream at twice its profile rate |
| packets per second | -m 1kpps, -m 5mpps |
total pps of the profile on this port |
| L2 bandwidth | -m 10mbps |
L2 bit/s including the 4-byte FCS |
| L1 bandwidth | -m 10mbpsl1 |
L1 bit/s |
| percent | -m 50% |
percent of line rate, measured on L1 |
The ratio between streams is kept: streams of 200 and 100 pps started with -m 600pps send 400 and 200 pps. Each port
gets the full multiplier unless --total divides it among the ports. While traffic runs, update -m 5kpps changes
it; a trailing + or - makes the change relative (update -m 10%+). Without --force, TRex refuses a multiplier
whose L1 rate would exceed the port speed ("Expected L1 B/W ... exceeds port line rate").
Latency streams ignore the multiplier
Streams with STLFlowLatencyStats are fixed-rate: the multiplier applies neither at start nor at update
(stateless guide, "Per stream latency/jitter/packet errors"; in the server source a latency stream is a "fixed rate
stream"). Latency packets are processed in software on the receive side, and multiplying them could overload it. To
change their rate, remove the stream and add it again with the new rate (for example through a --pps tunable);
its counters start again from zero. In a load test the latency streams keep measuring at a constant low rate -
exactly what you want.
The field engine
Because the data-plane cores replay a template, a stream sends the same bytes again and again. The field engine (FE) is a small instruction program attached to the template and executed by the data-plane core for every packet: it keeps variables, writes them into packet fields, fixes checksums and can change the packet size - at full speed and without Python. You need it whenever one stream must look like many flows:
- ECMP and LAG hashing - in the LVR fabric the VXLAN outer UDP source port is derived from the inner frame, so varying the inner UDP source port spreads a lab test over the underlay paths and both spines.
- Firewall tests - session tables and connection rates only show up with many sessions; one stream with 1 000 source ports creates 1 000 UDP sessions.
- MAC learning tests - varying the source MAC fills a switch's MAC table.
| Instruction | Purpose |
|---|---|
STLScVmRaw([...], cache_size=None) |
container for the instruction list (optionally caching pre-built packets) |
STLVmFlowVar(name, min_value, max_value, size, op, step) |
a variable of 1, 2, 4 or 8 bytes, incremented, decremented or randomised per packet (op="inc", "dec", "random"); IPv4 addresses may be given as strings |
STLVmWrFlowVar(fv_name, pkt_offset) |
writes the variable into the packet; pkt_offset may be a field name such as "UDP.sport" |
STLVmFixIpv4(offset="IP") |
recomputes the IPv4 header checksum after IP fields changed |
A lab example: 1 000 flows, one per source port, from the lab client behind K-L11 (VLAN 1314) to the lab client behind K-BL in VLAN 1315, routed by sw-rzk-BL. Aimed at the firewall test zone, the same stream would open 1 000 sessions sketch - validate on the bench.
base = (Ether(src="02:54:52:f0:00:04", dst=gw_mac) / Dot1Q(vlan=1314) /
        IP(src="10.3.14.151", dst="10.3.15.156", ttl=64) /
        UDP(sport=40000, dport=32009, chksum=0))                     # (1)!
vm = STLScVmRaw([
    STLVmFlowVar(name="sport", min_value=40000, max_value=40999, size=2, op="inc"),
    STLVmWrFlowVar(fv_name="sport", pkt_offset="UDP.sport"),       # (2)!
])
stream = STLStream(packet=STLPktBuilder(pkt=base / ("x" * (128 - len(base))), vm=vm),
                   mode=STLTXCont(pps=10000),
                   flow_stats=STLFlowStats(pg_id=2101))
gw_macis the resolved MAC of the VPN-CORE gateway on sw-rzk-BL. The FE changes a field covered by the UDP checksum, and the field engine writes bytes without knowing which checksums cover them - hence checksum 0 ("not used"). The alternative isSTLVmFixChecksumHw, which lets the NIC compute it.- Only the source port changes, so the IPv4 header checksum stays valid. If you vary
IP.src, addSTLVmFixIpv4(offset="IP").
Checksums are your job
TRex's receive side ignores L4 checksums, but a firewall or IPS that validates them may drop packets. The same
applies to latency streams: TRex writes its signature into the payload after Scapy computed the UDP checksum, so
an automatic checksum is wrong on the wire. LVR templates therefore use UDP(..., chksum=0). For flow-stat
streams TRex's own rewrites are harmless: the IPv4 ID and the TOS bit are not covered by the UDP checksum.
confirm on the bench with a capture through the firewalls
Why the monitoring profile does not use the field engine
Each monitoring stream has one fixed 5-tuple, hence one ECMP hash result and one firewall session: its latency series describes one concrete path. Path diversity comes from many streams with different source ports, not from varying fields inside one stream, which would average several paths into one number.
Profiles and tunables
A profile is a Python file with a class that has a get_streams() method and a module-level register() function
returning an instance of the class. Tunables are parameters passed when the profile is loaded, so that one file covers
many streams. Current TRex releases (v3.x) parse tunables with argparse, as the examples shipped in stl/ do. The
skeleton below builds one LVR-style stream (single- or double-tagged, latency or loss-only)
sketch - validate on the bench:
from trex.stl.api import *
import argparse


class LvrUdpStream(object):

    def get_streams(self, tunables, **kwargs):                       # (1)!
        p = argparse.ArgumentParser(description="LVR UDP test stream")
        p.add_argument("--svlan", type=int, default=0)               # 0 = no S-tag (lab port)
        p.add_argument("--cvlan", type=int, default=1314)
        p.add_argument("--smac", default="02:54:52:01:05:22")
        p.add_argument("--dmac", default="02:54:52:06:05:22")
        p.add_argument("--sip", default="10.3.14.101")
        p.add_argument("--dip", default="10.3.14.106")
        p.add_argument("--sport", type=int, default=40001)
        p.add_argument("--dport", type=int, default=32001)
        p.add_argument("--tos", type=int, default=0)
        p.add_argument("--size", type=int, default=128)              # without FCS
        p.add_argument("--pps", type=float, default=200)
        p.add_argument("--pg_id", type=int, default=1)
        p.add_argument("--latency", type=int, default=1)             # 1 = latency stream, 0 = loss only
        a = p.parse_args(tunables)                                   # (2)!

        pkt = Ether(src=a.smac, dst=a.dmac)
        if a.svlan:
            pkt = pkt / Dot1Q(vlan=a.svlan)
        pkt = (pkt / Dot1Q(vlan=a.cvlan) /
               IP(src=a.sip, dst=a.dip, tos=a.tos, ttl=64) /
               UDP(sport=a.sport, dport=a.dport, chksum=0))
        pad = max(0, a.size - len(pkt)) * "x"
        stats = STLFlowLatencyStats(pg_id=a.pg_id) if a.latency else STLFlowStats(pg_id=a.pg_id)
        return [STLStream(packet=STLPktBuilder(pkt=pkt / pad),
                          mode=STLTXCont(pps=a.pps),
                          flow_stats=stats)]


def register():                                                      # (3)!
    return LvrUdpStream()
- TRex calls
get_streams()with the keyword argumentstunables(a list such as["--cvlan", "1315"]),direction(port number modulo 2) andport_id; collect the unused ones in**kwargs. Do not give defaults to only some named parameters: TRex inspects the signature and rejects partly defaulted ones. argparseturns the list into typed values; an unknown tunable stops the load with an error.register()is what the console andSTLProfile.load()call to get the profile object.
How tunables are passed:
- Console:
start -f lvr_udp_stream.py ... -t cvlan=1315,pps=100. Thekey=value,...form is converted to--cvlan 1315 --pps 100.-ttakes the rest of the line, so it must be the last option.start -f lvr_udp_stream.py -t --helpprints the tunables of a profile and starts nothing. - Python:
c.add_profile("lvr_udp_stream.py", ports=[0], cvlan=1315, pps=100).
Test a profile without touching the network
The simulator stl-sim in the TRex package runs a profile through the same compiler and writes the packets to a
PCAP file: ./stl-sim -f lvr_udp_stream.py -o /tmp/check.pcap -l 10 (--pkt prints them with Scapy). Check tags,
addresses and sizes in Wireshark before a single packet reaches a TX switch.
Port attributes and port modes
Promiscuous mode and multicast
A TRex port receives a frame only if the destination MAC equals the port's own MAC - unless the port is in promiscuous mode, which is off by default (stateless guide, "Tutorial: Source and Destination MAC addresses").
In the LVR platform
LVR streams are addressed to deterministic client MACs (02:54:52:...) or come back from a gateway with such a MAC
as destination - never to a TRex port MAC. Without promiscuous mode the NIC would drop every returning frame and
every stream would show 100 % loss. Both instances run their ports promiscuous; trex-mon also enables multicast
reception for EMU (chapter 6).
| Action | Console | Python |
|---|---|---|
| promiscuous on, all owned ports | portattr -a --prom on |
c.set_port_attr(ports=[0, 1], promiscuous=True) |
| multicast on | portattr -a --mult on |
c.set_port_attr(ports=[0, 1], multicast=True) |
| show attributes | portattr or stats --ps |
c.get_port_attr(port=0) |
L2 mode and L3 mode
A port is in L2 or L3 mode (stateless guide, "Tutorial: Port layer mode configuration"). The mode decides which destination MAC TRex uses for streams that do not set one, and whether the port takes part in ARP:
- L2 mode: you give the destination MAC - console
l2 -p 0 --dst 02:54:52:f0:00:07, Pythonc.set_l2_mode(port=0, dst_mac="02:54:52:f0:00:07"). - L3 mode: you give a source IPv4 address and a next hop, which TRex resolves by ARP - console
l3 -p 0 --src 10.3.14.151 --dst 10.3.14.1 --vlan 1314, Pythonc.set_l3_mode(port=0, src_ipv4="10.3.14.151", dst_ipv4="10.3.14.1", vlan=1314).arp -p 0(Pythonc.resolve(ports=[0])) repeats the resolution; in L3 mode the port also sends periodic gratuitous ARP.
Both require service mode (next section). The VLAN given to l3, arp or vlan -p 0 --vlan 1314 (Python
set_vlan; two values mean QinQ) tags only the port's control traffic - ARP and gratuitous ARP. Stream packets
carry exactly the tags you built into them.
In the LVR platform
LVR streams set both MACs explicitly, so the port mode does not change them. L3 mode is handy on trex-lab to resolve a gateway before a routed test (for example 10.3.14.1 on sw-rzk-BL), using only reserved pool addresses as source. On trex-mon, hundreds of clients in many VLANs are handled by EMU instead, because a port in L3 mode has only one address (chapter 6).
Service mode: normal, service and filtered
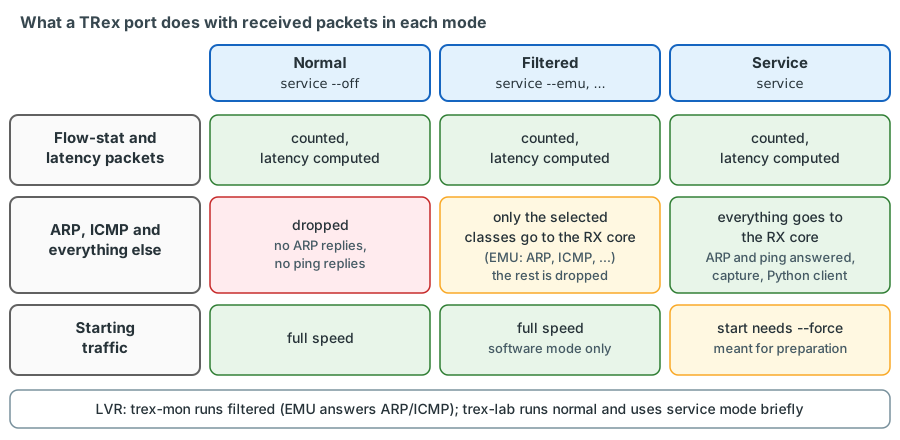
To stay fast, a port in normal operation ignores almost everything it receives: it counts statistics packets, processes latency packets and drops the rest - it does not even answer ARP or ping. Service mode changes that:
| Mode | Console | Received packets |
|---|---|---|
| normal | service --off |
flow-stat and latency packets are counted; everything else is dropped |
| service | service |
everything goes to the RX core: the port answers ARP and ping, packets can be captured or handed to the Python client |
| filtered | service --emu, --no-tcp-udp, --bgp, --dhcp, --mdns, --tran, --all |
only the selected packet classes go to the RX core; counting continues at full speed. Software mode only |
In Python: c.set_service_mode(ports, enabled=True) or c.set_service_mode(ports, enabled=False, filtered=True,
mask=...); enabled and filtered are mutually exclusive. Full service mode is for preparation, not for load:
start refuses to run on a port in service mode unless you add --force.
In the LVR platform
trex-mon runs its ports in filtered service mode so that EMU can answer ARP and ICMP for the TRex clients while the monitoring streams run (chapter 6 explains the mask). trex-lab normally runs in normal mode and enters service mode only briefly, to resolve a gateway or capture a few packets.
Ping and capture
With a port in service mode and L3 mode, ping -p 0 -d 10.3.14.1 --vlan 1314 (Python
c.ping_ip(src_port=0, dst_ip="10.3.14.1", vlan=1314)) is the quickest proof that a lab port reaches the gateway in
VLAN 1314 through TX switch and Leaf. For a lab port pinned to a Leaf attachment point (trex-lab port 0 = p4 at K-L11)
it is also the commissioning check that ARP towards the centralised gateway on sw-rzk-BL works through the VXLAN
tunnel (chapter 10).
Packet capture keeps packets in fast server-side queues and accepts BPF filters (stateless guide, "Packet capturing",
documented for service mode). capture monitor start --rx 0 -v shows packets live (capture monitor stop ends it);
capture record start --rx 0 --limit 200 stores them, and capture record stop --id <id> -o /tmp/rx_0.pcap writes a
PCAP. BPF follows tcpdump syntax: a plain udp does not match tagged frames; each tag needs a vlan keyword
(vlan and vlan and udp for monitoring frames). confirm on the bench
Working from the console
Connecting to the two LVR instances
trex-console lives in the TRex installation directory (chapter 17); each instance has its own RPC and publisher
ports confirm on the bench:
cd /opt/trex/current
./trex-console -p 4501 --async_port 4500 -r     # trex-mon: read-only - look, never touch
./trex-console -p 4601 --async_port 4600        # trex-lab: acquires all four lab ports
Other options: -s <host> remote server, -r read-only (acquires nothing), -a 2 3 acquire only these ports, -f
force-acquire, --emu also start the EMU client, -t start in the TUI. By default the console tries to acquire all
ports; if one is owned by someone else it stops with "Failed to acquire all required ports" - the safe outcome on
trex-mon. Because the monitoring streams run without an owner between two trexctl apply runs (chapter
2), do not rely on that error: open trex-mon with -r.
Port numbers inside an instance
"p0-p7" are the platform's names for the eight X710 ports. Inside each instance the ports are numbered from 0 in the
order of its configuration file: on trex-mon p0-p3 are ports 0-3, on trex-lab p4-p7 are ports 0-3. With the
default pins, trex-lab port 0 (p4) reaches K-L11, port 1 (p5) K-L41, port 2 (p6) the firewall zone FWZ (AP K-BL
with VLAN 4003), port 3 (p7) C-L21.
A complete lab session, step by step
A loss test in VLAN 1314 between the lab clients behind K-L11 (trex-lab port 0) and C-L21 (port 3), using
lvr_udp_stream.py from above (stored as /opt/lvr/profiles/lvr_udp_stream.py). These are commands, not recorded
output confirm on the bench:
trex>portattr -a --prom on
trex>stats --ps
trex>start -f /opt/lvr/profiles/lvr_udp_stream.py --port 0 -m 1kpps -t cvlan=1314,smac=02:54:52:f0:00:04,dmac=02:54:52:f0:00:07,sip=10.3.14.151,dip=10.3.14.160,dport=32009,pg_id=2001,latency=0
trex>start -f /opt/lvr/profiles/lvr_udp_stream.py --port 3 -m 1kpps -t cvlan=1314,smac=02:54:52:f0:00:07,dmac=02:54:52:f0:00:04,sip=10.3.14.160,dip=10.3.14.151,dport=32009,pg_id=2002,latency=0
trex>streams --port 0 3
trex>stats -p
trex>stats -s
trex>tui
trex>update --port 0 3 -m 5kpps
trex>pause --port 0 3
trex>resume --port 0 3
trex>stop -a
| Step | What it does | What to look for |
|---|---|---|
portattr -a --prom on, stats --ps |
promiscuous on, then the port status table | link up, promiscuous on, 10 Gb/s |
start ... --port 0 -m 1kpps -t ... |
removes the streams of the default profile on port 0, attaches the new ones and starts them at 1 000 pps | each step reports SUCCESS or an error; -t comes last |
streams --port 0 3 |
loaded streams: packet type, length, mode, rate, PG ID | Ethernet:802.1Q:IP:UDP:Raw; length 132 for a 128-byte packet (the table adds the FCS) |
stats -p, stats -s |
port counters, then per-pg_id counters | ipackets of 2001 follow its opackets (chapter 5) |
tui |
live text UI | d dashboard, s streams, l latency (h histogram), u utilisation, c clear view, p/r pause/resume, digits = port view, q back |
update, pause, resume |
change the multiplier, hold and continue continuous streams | latency streams would keep their rate |
stop -a |
stops all active profiles of the owned ports | --remove also deletes the streams |
The stateless guide shows a successful start from TRex docs ("Tutorial: Load TRex server,
Simple IPv4 UDP"; four ports in that lab). The guide's command line ends with -a; v3.08 no longer accepts that option
and uses all acquired ports when --port is omitted, so it is left out here:
trex>start -f stl/udp_1pkt_simple.py -m 10mbps
Removing all streams from port(s) [0, 1, 2, 3]:              [SUCCESS]
Attaching 1 streams to port(s) [0, 1, 2, 3]:                 [SUCCESS]
Starting traffic on port(s) [0, 1, 2, 3]:                    [SUCCESS]
Ownership, force and reset
| Command | Effect | trex-lab | trex-mon |
|---|---|---|---|
acquire --port 2 3 |
take free ports | yes | reserve ports p2/p3 only, if agreed |
acquire -a --force, console -f |
take ports from their current owner | only if the owner is known to be gone | never |
reset |
stop, remove all streams and clear the statistics in this client's view, on the console's own ports (-r also restarts the NIC ports); Python reset() force-acquires the ports first |
to clean up | never |
start on an owned port |
first removes the streams of that profile | normal | never on p0/p1 |
stats, streams, tui |
read only | yes | yes, from a -r console |
Production impact
On trex-mon a forced acquire, a reset or a start on p0/p1 removes or stops the permanent monitoring streams:
Grafana shows every path as down and alerts may fire for the whole fabric. Connect to trex-mon with -r, look with
stats and tui, and run tests on trex-lab or through the monitoring tooling (chapter 18).
Working from Python
The Python API is what trexctl will be built on. The sketch runs the console test above - plus one latency stream per direction - for 30 seconds and prints port counters, loss and latency. sketch - validate on the bench
import sys
import time
sys.path.insert(0, "/opt/trex/current/automation/trex_control_plane/interactive")
from trex.stl.api import *                        # STLClient, STLStream, Scapy layers, TRexError

PORT_A, PORT_B = 0, 3                             # p4 -> K-L11, p7 -> C-L21
A = {"mac": "02:54:52:f0:00:04", "ip": "10.3.14.151"}    # fixed MAC of p4, lab IP of K-L11
B = {"mac": "02:54:52:f0:00:07", "ip": "10.3.14.160"}    # fixed MAC of p7, lab IP of C-L21


def stream(src, dst, sport, pg_id, pps, latency):
    pkt = (Ether(src=src["mac"], dst=dst["mac"]) / Dot1Q(vlan=1314) /
           IP(src=src["ip"], dst=dst["ip"], ttl=64) / UDP(sport=sport, dport=32009, chksum=0))
    stats = STLFlowLatencyStats(pg_id=pg_id) if latency else STLFlowStats(pg_id=pg_id)
    return STLStream(packet=STLPktBuilder(pkt=pkt / ("x" * (128 - len(pkt)))),
                     mode=STLTXCont(pps=pps), flow_stats=stats)


c = STLClient(server="127.0.0.1", sync_port=4601, async_port=4600)      # (1)!
try:
    c.connect()
    c.acquire(ports=[PORT_A, PORT_B], force=False)                       # (2)!
    c.reset(ports=[PORT_A, PORT_B])                                       # (3)!
    c.set_port_attr(ports=[PORT_A, PORT_B], promiscuous=True)
    c.add_streams([stream(A, B, 40001, 2001, 1000, False),
                   stream(A, B, 40002, 2003, 100, True)], ports=[PORT_A])
    c.add_streams([stream(B, A, 40001, 2002, 1000, False),
                   stream(B, A, 40002, 2004, 100, True)], ports=[PORT_B])
    c.start(ports=[PORT_A, PORT_B], mult="1")                             # (4)!
    time.sleep(30)
    c.stop(ports=[PORT_A, PORT_B], rx_delay_ms=100)                       # (5)!
    st = c.get_stats()                                                    # (6)!
    print("port 0 opackets", st[PORT_A]["opackets"], "ipackets", st[PORT_A]["ipackets"])
    for pg in (2001, 2002, 2003, 2004):
        tx = st["flow_stats"][pg]["tx_pkts"]["total"]
        rx = st["flow_stats"][pg]["rx_pkts"]["total"]
        print(f"pg_id {pg}: tx {tx} rx {rx} lost {tx - rx}")
    for pg in (2003, 2004):
        lat = st["latency"][pg]["latency"]
        print(f"pg_id {pg}: avg {lat['average']} us, max {lat['total_max']} us, jitter {lat['jitter']} us")
except TRexError as e:                                                    # (7)!
    print(f"TRex error: {e}")
finally:
    c.disconnect()                                                        # (8)!
- RPC 4601 and publisher 4600 select trex-lab; trex-mon would be 4501/4500.
- Without
force,acquire()fails if another client owns the ports - deliberately. reset()force-acquires, stops traffic, removes all streams and clears the statistics in this client's view (chapter 5); after step 2 it only touches ports we own.mult="1"keeps the profile rates. Alternativelystart(..., duration=30)followed bywait_on_traffic(ports, rx_delay_ms=100)lets TRex stop the traffic itself.- Stops the traffic and keeps the receive filters 100 ms longer so that late packets are still counted (chapter 5).
get_stats()returns the port counters (keyed by port number),global,flow_statsandlatency;get_pgid_stats([...])returns only the last two for selected pg_ids.- API errors raise
TRexError(older examples use the aliasSTLError). disconnect()stops the client's traffic and releases its ports by default.
How the LVR platform uses STL
| trex-mon (permanent monitoring) | trex-lab (on-demand tests) | |
|---|---|---|
| Ports | p0/p1 active (p2/p3 reserve), trunks carrying all S-VLANs | p4-p7 (lab ports 0-3), QinQ access ports pinned to one AP each |
| Frames | double-tagged S-VLAN / C-VLAN |
single-tagged C-VLAN |
| Streams | about 176 continuous streams: 74 latency streams at 200/100/50 pps and 102 loss-only streams at 100 pps (chapter 16) | whatever the test needs: line-rate streams, bursts, field-engine flows, a few latency streams |
| Destination MAC | remote TRex client (L2) or gateway MAC resolved by EMU (routed classes) | remote lab client (L2) or a resolved gateway |
| Server mode | --software --emu with c: 1 (one-queue receive model, so that latency is accurate - chapter 3), filtered service mode for EMU |
hardware mode (X710 flow statistics, line rate) or ASTF |
| Who starts the streams | the monitoring runner via the Python API (planned: trexctl, chapter 18) | an engineer via console or Python, later the trexctl test runner |
Everything trexctl will do maps to this chapter: Scapy packets, add_streams() per port, start(), update(),
stop() and get_pgid_stats(). Without trexctl, the console and a script like the one above do the same job.
Pitfalls
| Symptom | Likely cause | Check / fix |
|---|---|---|
| 100 % loss from the first second | wrong destination MAC (not the remote client, not the gateway) or port not promiscuous | portattr; compare DA with the inventory; capture on the receiving port |
| 100 % loss on trex-mon after a profile change | outer tag missing: the TX switch reads the C-tag as outer VLAN; VLAN 1314 is not permitted on the monitoring trunk, so the frame is discarded | build Dot1Q(svlan)/Dot1Q(cvlan); check with stl-sim --pkt |
| Frames reach the wrong AP | wrong S-VLAN for the source AP | AP table in chapter 13 |
| "Need at least 16 payload bytes for payload rules" | latency template too small for the signature | pad the packet (LVR size 128) |
| "For payload rules: Can't have two streams with same pg_id, or same stream on more than one port" | one latency profile started on two ports | unique pg_id per latency stream (the TRex example adds port_id to the pg_id) |
-m has no effect on some streams |
they are latency streams | remove and re-add them with the new rate (their counters restart) |
| Tunables ignored or an argparse error | -t not last, or a typo in a tunable |
-t last; start -f profile.py -t --help |
| Bandwidth differs from switch counters | packet size vs L2 vs L1, FCS | accounting table above |
| Firewall drops FE or latency streams | invalid UDP checksum | UDP(chksum=0); for field-engine streams alternatively STLVmFixChecksumHw |
Key takeaways
- A stream is a packet template + mode + rate + optional field engine + optional statistics object with a pg_id; a
profile is a Python file whose
get_streams()returns streams and whoseregister()returns the profile object. - The LVR monitoring frame is 128 bytes without FCS: deterministic MACs, S-tag = AP, C-tag = production VLAN, deterministic IPs, UDP 40000+n -> 32000+class with checksum 0, TTL 64, room for the 16-byte latency signature. On the wire TRex replaces the IPv4 ID and sets bit 0 of the TOS byte.
- TRex packet size excludes the FCS; L2 adds 4 bytes, L1 adds 24. A 10G port carries 14,880,952 pps of 64-byte frames and 812,743 pps of 1518-byte frames.
- The multiplier scales a profile (
-m 2,1kpps,10mbps= L2 incl. FCS,10mbpsl1,50%= L1); latency streams are fixed-rate and ignore it. - The field engine changes fields per packet in the data plane - for ECMP, firewall or MAC-learning tests - and checksums remain your responsibility.
- Ports must be promiscuous for LVR streams to be received; L2/L3 mode and port VLANs affect only default MACs and control traffic; service mode decides what else reaches the RX core.
- Inside each instance ports are numbered from 0: trex-lab ports 0-3 are p4-p7.
- On trex-mon you only look (
trex-console -r);reset, forced acquire andstarton p0/p1 destroy the monitoring.
Check your understanding
1. Name the parts of a TRex stream and say which one carries the pg_id.
A packet template (Scapy), an optional field-engine program, a transmission mode, a rate, optional chaining
(isg, self_start, next) and an optional statistics object. The pg_id belongs to the statistics object:
STLFlowStats(pg_id=...) for loss-only counting, STLFlowLatencyStats(pg_id=...) for latency as well.
2. Why does the monitoring frame carry two VLAN tags on p0, and what happens to the outer one?
The outer tag (S-VLAN, e.g. 3101) tells the TX switch which attachment point the frame must leave through, because each S-VLAN contains only one AP port plus the TRex trunks. The inner tag (e.g. 1314) is the production VLAN being measured. The TX switch pops the S-tag towards the Leaf and pushes the S-VLAN of the receiving AP on the way back.
3. A colleague builds a 1518-byte packet in Scapy, starts it with -m 9.9gbps and expects 812,743 pps. What happens?
gbps means L2 including the FCS: 1522 bytes per packet, about 813,075 pps, which needs 10.03 Gbit/s at L1 - more
than the port. Without --force TRex refuses to start ("Expected L1 B/W ... exceeds port line rate"). 812,743 pps
is the line rate of a 1518-byte frame including FCS, i.e. a 1514-byte TRex packet; build that and use -m 100%.
4. A profile has a loss-only stream at 1000 pps and a latency stream at 100 pps. What do you get with -m 5?
5,000 pps for the loss-only stream and still 100 pps for the latency stream: latency streams are fixed-rate so that a load test cannot overload the receive path that processes every latency packet in software.
5. Why does each monitoring stream have its own UDP source port instead of one stream varying it with the field engine?
A fixed 5-tuple gives one ECMP hash result and one firewall session, so the stream measures one concrete path. Varying the port inside a stream would spread its packets over several paths and average them into one number.
6. A new lab stream shows 100 % loss, but a capture on the TX switch shows the frames returning to the lab port. What do you check first?
Promiscuous mode on the receiving TRex port (portattr, stats --ps). The frames are addressed to a client MAC,
not to the port MAC, so a non-promiscuous port drops them in the NIC.
7. What happens if you connect a normal console (without -r) to trex-mon while the monitoring runner owns p0 and p1? And with -f?
The console tries to acquire all ports, fails on p0/p1 and exits with "Failed to acquire all required ports" -
nothing is disturbed. With -f it would take p0/p1 away from the runner, and a following start or reset would
remove the monitoring streams. Use -r on trex-mon.
8. Why must -t be the last option of start, and how do you see a profile's tunables?
-t takes the remainder of the line and hands it to the profile's own argparse parser, so anything after it would
be read as a tunable. start -f profile.py -t --help prints the tunables and starts nothing.
References
- TRex stateless guide, https://trex-tgn.cisco.com/trex/doc/trex_stateless.html: "TRex Objects", "RPC Architecture", "Tutorial: Load TRex server, Simple IPv4 UDP", "Tutorial: Source and Destination MAC addresses", "Tutorial: Simple IPv4/UDP packet simulator", "Tutorial: Port layer mode configuration", "Port service mode", "Packet capturing", "Neighboring protocols", "Traffic profile tutorials" (modes, field engine, tunables), "Dynamic multiple profiles", "Tutorial: Per stream latency/jitter/packet errors".
- TRex Stateless Python API, Client Module, https://trex-tgn.cisco.com/trex/doc/cp_stl_docs/api/client_code.html:
STLClient,acquire,reset,add_streams,add_profile,start,stop,update,wait_on_traffic,get_stats,get_pgid_stats,set_port_attr,set_service_mode_base,set_l2_mode,set_l3_mode,set_vlan,resolve,ping_ip,start_capture. - TRex manual, https://trex-tgn.cisco.com/trex/doc/trex_manual.html, "Platform configuration" (order of
interfacesdefines the port numbers). - trex-core source, master = v3.08 (https://github.com/cisco-system-traffic-generator/trex-core), under
scripts/automation/trex_control_plane/interactive/trex/:utils/parsing_opts.py(multiplier formats, tunables,portattr,service,statsoptions),stl/trex_stl_client.py(console commands, ownership checks),stl/trex_stl_streams.py(modes,STLStream,STLProfile.load_py),stl/trex_stl_packet_builder_scapy.py(field engine),console/trex_console.pyandtrex_tui.py(console options, TUI keys); andsrc/stx/stl/trex_stl_stream.h/.cpp(rate calculation with +4 and +20 bytes, fixed-rate latency streams),src/stx/stl/trex_stl_port.cpp(line-rate check),src/stx/stl/trex_stl_fs.cpp(latency stream errors),scripts/stl/flow_stats_latency.py(current profile style). - Scapy 2.8.0, https://scapy.net - hexdump of the monitoring frame computed locally.
- LVR S-VLAN, AP and addressing plan: chapters 12, 13, 14, 16.