19. Dashboards and alerts for LVR
In this chapter
You will learn
- the purpose, panels and variables of the eight planned TRex dashboards and how to move between them
- what "normal" looks like on each dashboard and how typical problems show up: a path down on one AP, loss on all RZC streams, a latency step after a firewall failover, rising jitter
- why latency streams and flow-stat streams look different on every panel
- the Flux queries behind the key panels
- every alert rule with its exact condition, timing, grouping and No Data handling
- how maintenance windows, the 7-day baseline and threshold tuning are handled
- how dashboards and rules get from git into Grafana - with trexctl and without it
Prerequisites: Chapter 8, Chapter 9, Chapter 16
This chapter is the user manual for the monitoring output of the platform. Chapters 8 and 9 explained the tools; here they are applied to the LVR stream matrix of chapter 16: 74 latency streams and 102 flow-stat streams (176 streams, about 20.6 kpps) between the attachment points in Kalk and Chorweiler. The dashboards and rules described here are the planned design - none of them exists yet, so all pictures are mock-ups with invented values, and all queries must be validated against real data when the platform is built.
How the dashboards fit together
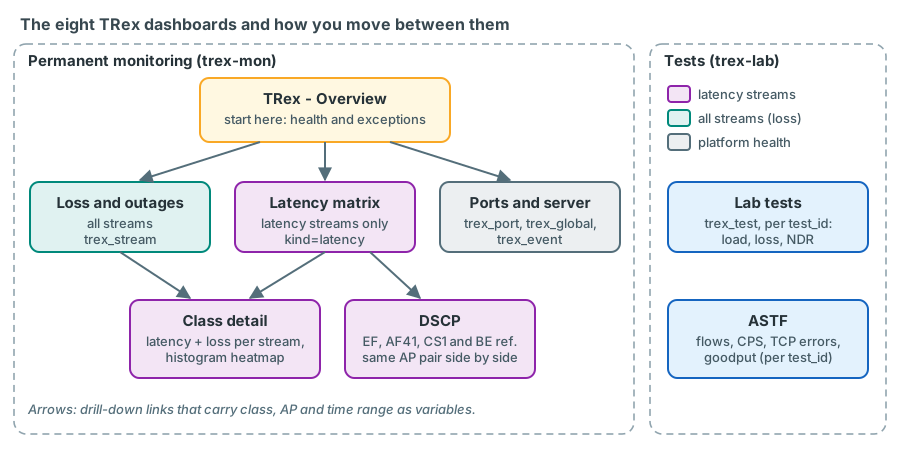
All eight dashboards live in one Grafana folder, TRex, provisioned from files (see the last section). Six serve the
permanent monitoring of trex-mon, two the on-demand tests of trex-lab.
| Dashboard | Question it answers | Variables | Data |
|---|---|---|---|
| TRex - Overview | Is everything healthy right now? | - | trex_global, trex_stream, trex_event |
| TRex - Latency matrix | How long does each AP pair take, and where is it unusual? | class, vlan, dscp |
trex_stream, kind=latency |
| TRex - Loss and outages | Which streams lost packets, when, and for how long? | class, dc_pair, src_ap, dst_ap |
trex_stream, all streams |
| TRex - Class detail | Everything about the streams of one class | class, src_ap, dst_ap, vlan |
trex_stream |
| TRex - DSCP | Are EF, AF41 and CS1 treated differently from BE? | src_ap, dst_ap |
trex_stream, class DSCP (16 streams including the BE reference) |
| TRex - Ports and server | Is the measurement system itself healthy? | instance |
trex_port, trex_global, trex_event |
| TRex - Lab tests | What did a throughput or soak test find? | test_id |
trex_test |
| TRex - ASTF | What did a stateful firewall test find? | test_id |
trex_test |
Drill-down links (Grafana data links) carry the current time range and the clicked class or AP into the next
dashboard, so you never have to re-enter what you were looking at. For time ranges longer than about a day, switch
the dashboards to the InfluxDB-trex-longterm data source (a data source variable makes this one click); remember
that there, drop_pkts means lost packets per minute and lat_max_us the worst value of a minute.
Two kinds of streams on every dashboard
The most important thing to keep in mind when reading any panel is which kind of stream you are looking at. TRex can measure latency for at most 128 streams per instance, so the monitoring profile splits its streams (chapter 16):
Latency streams (kind=latency) |
Flow-stat streams (kind=flowstat) |
|
|---|---|---|
| Which | VLAN 1314 L2 (intra- and inter-DC), L3-BL, L3-DCFW, L3-ENTFW, DSCP - groups l2-intra-rzk, l2-intra-rzc, l2-inter-dc, l3-bl, l3-dcfw, l3-entfw, dscp-l2-interdc, dscp-entfw: 74 streams |
VLAN 1315 L2 and the L2 streams of the production VLANs - groups l2-coverage-1315 (34) and l2-coverage-prod (68): 102 streams |
| Rate | 200 pps (fabric), 50 pps (through firewalls), 100 pps (DSCP L2) | 100 pps |
| Fields | loss and latency: lat_avg_us, lat_max_us, jitter_us, hist_*, ... |
loss only: tx_pps, rx_pps, drop_pkts, ... |
| Shown on | every dashboard | Overview counts, Loss and outages, Class detail (loss panels) |
Consequences for the dashboards:
- Every latency query filters
r.kind == "latency". The variable lists of the Latency matrix, DSCP and the latency part of Class detail are built from latency streams only, so you cannot select an empty combination such as VLAN 1315. - Where a table lists all streams of a class (Class detail), latency columns of flow-stat streams are empty by design; the panel's No value text says "loss only" instead of a misleading dash.
- Loss is comparable across both kinds, but the resolution differs: one lost packet means 5 ms of outage at 200 pps, 10 ms at 100 pps and 20 ms at 50 pps. That is why outage tables divide by the stream's own rate.
The dashboards one by one
TRex - Overview
Purpose. The page that is open on the wall screen and the first one you check every morning. It shows the health of the measurement system and the number of exceptions, not individual streams.
Panels. Instance state of trex-mon (up/down from the age of the last trex_global point), TRex CPU and RX core
CPU, total TX and RX packet rate, the number of streams that dropped packets in the last 5 minutes, the number of
streams without any RX in the last 30 seconds ("path down"), the worst interval maximum per class (bar gauge), and
an event list (trex_event and annotations).
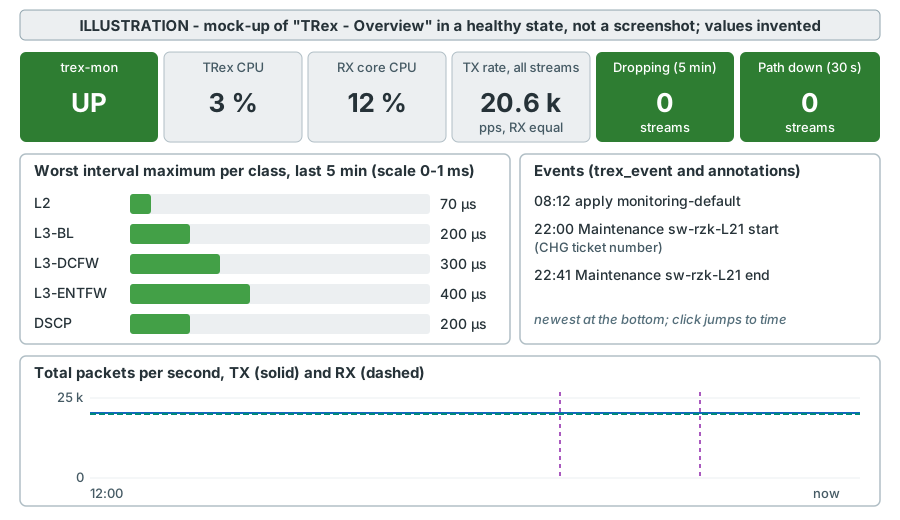
Normal. Instance UP; both counters 0; TX and RX rate equal at the profile's total (about 20.6 kpps); RX core CPU stable; the latency bars at their baseline; events only for planned actions.
Problems. A non-zero "path down" counter is the most urgent signal - go to Loss and outages and look at which streams. "Dropping" without "path down" means partial loss. A red instance tile with all other panels empty means the exporter, TRex or InfluxDB has stopped - nothing else on the page is meaningful until that is fixed (chapter 25).
TRex - Latency matrix
Purpose. One-way latency for every measured AP pair of a class at a glance - source APs as rows, destination APs
as columns, each cell the mean of lat_avg_us and the maximum of lat_max_us over the selected time range.
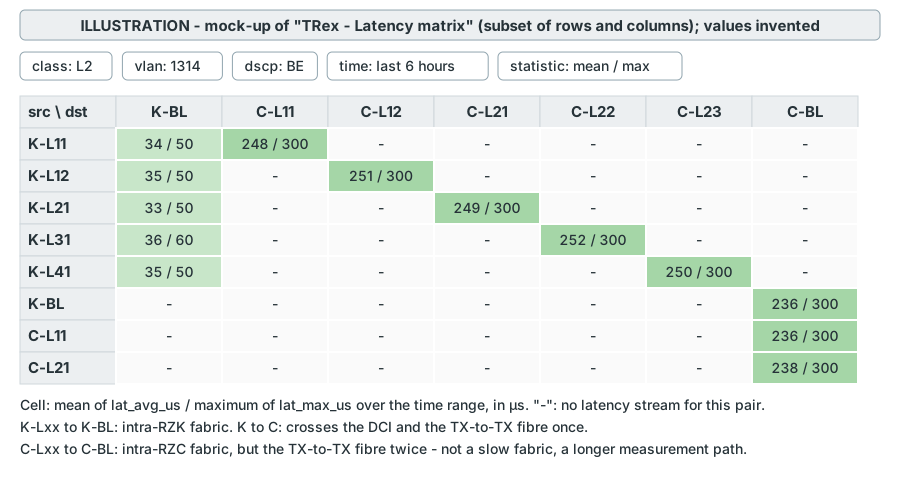
How to read it. Compare like with like. Within a row type the values should be very similar: all RZK Leafs to K-BL are fabric paths of the same length; all inter-DC pairs cross the DCI once. Absolute values contain the measurement path, not only the production path: an RZK to RZC stream crosses the TX-to-TX fibre once, an RZC to RZC stream twice, so intra-RZC cells are higher than intra-RZK cells by twice the one-way fibre delay (about 5 µs per km) plus the extra TX switch hop, without anything being wrong (chapter 14). Above 100 µs the maximum has 100-µs resolution: "300" means "the worst packet was below 300 µs".
Problems. A single cell that differs from its peers points to that pair's path (a Leaf, a link, a queue); a whole row or column that differs points to the AP common to it. All cells of a class rising together point to a shared element - for the firewall classes usually the firewall itself.
TRex - Loss and outages
Purpose. Every lost packet, for all streams of both kinds: lost packets per minute per stream (bar chart), lost packets per DC pair and per class, a table of streams sorted by lost packets, and the outage table: lost packets divided by the stream's rate, in seconds, for the selected time range.
How to read it. The outage table is the main tool after a maintenance window or an incident: set the time range to the window, sort by outage seconds. Streams through a rebooted device show its full downtime; all other streams reveal how long the fabric needed to converge. With the monitoring rates the resolution is 5 to 20 ms; for millisecond resolution raise the rate before a planned event (chapter 23).
Normal. Empty bars. Isolated single lost packets do happen in any real network and are no reason for action unless they repeat on the same stream.
TRex - Class detail
Purpose. All streams of one class, for example L3-ENTFW: average and interval maximum latency per stream, jitter,
RX rate, lost packets, and a latency heatmap of one selected stream built from its hist_* buckets.
How to read it. The heatmap shows the latency distribution over time: a narrow band is a stable path; a band that becomes wider means variable queueing; a second band means that part of the packets see a different delay - a periodic disturbance, or a path change within the selected time range. The bucket keys are lower bounds and the bucket width grows tenfold per decade (10 µs, 100 µs, 1 ms), so the heatmap uses a logarithmic y axis.
TRex - DSCP
Purpose. Show whether the network treats traffic classes differently. The two DSCP groups, dscp-l2-interdc and
dscp-entfw, send four copies of the same stream that differ only in the TOS byte - 0x00 (BE, the reference), 0xB8
(EF), 0x88 (AF41) and 0x20 (CS1) - on two pairs: K-L11 to C-L21 (L2, 256 bytes, 100 pps) and K-L11 to the zone client
at K-BL, 10.9.90.106 in VLAN 4003 (L3-ENTFW through the Enterprise firewall, 256 bytes, 50 pps), both directions:
4 x 2 x 2 = 16 latency streams. Latency and loss per DSCP value are shown side by side for the selected pair, always
against the BE copy of the same pair.
Normal. The fabric has no QoS trust or scheduling configured, so in an unloaded network all values must be equal within jitter. A difference appears only where a device queues or remarks by DSCP - typically a firewall - or under congestion.
Why the BE reference is part of the DSCP groups
A class can only be compared with a stream that is identical except for the TOS byte: same pair, same 256-byte
frames, same rate, same path. The regular streams do not qualify - the L3-ENTFW stream from K-L11 to the zone uses
128-byte frames, and the inter-DC L2 streams run between other pairs (K-L11 to C-L11, K-L21 to C-L21). Each DSCP
group therefore carries its own BE copy, tagged class=DSCP, dscp=BE. In captures the four TOS bytes read 0x01,
0xB9, 0x89 and 0x21: TRex sets the lowest TOS bit on every statistics packet, the DSCP itself is unchanged
(chapter 5).
TRex - Ports and server
Purpose. Health of the measuring system: TX and RX bit rate per TRex port (RX drawn as negative values so the two
mirror each other), port errors (ierrors, oerrors), tx_queue_full, TRex and RX core CPU, the exporter lag
(exporter_lag_ms) and the event list. A rising RX core CPU or queue_full means TRex itself may drop or delay
packets - in software mode the RX core handles every monitoring packet. Loss or jitter that coincides with it is a
measurement problem, not a network problem: check this dashboard before you call the network team about a subtle
effect.
TRex - Lab tests
Purpose. Results of on-demand tests from trex_test, selected by test_id: offered versus received load, loss in
percent and latency per load step, and a summary table of the no-drop rate (NDR) per frame size. Compare the NDR with
the expected capacity of the path (for example one 10G attachment point), and use the test's start and end
annotations to check on the monitoring dashboards whether the test disturbed other streams.
TRex - ASTF
Purpose. Results of stateful tests through the Enterprise firewall: active and established flows, connections per second, TCP errors, client and server goodput, latency histogram. decision The field names are defined together with the ASTF runner of trexctl (chapter 18); until then this dashboard is a placeholder.
Recognising typical problems
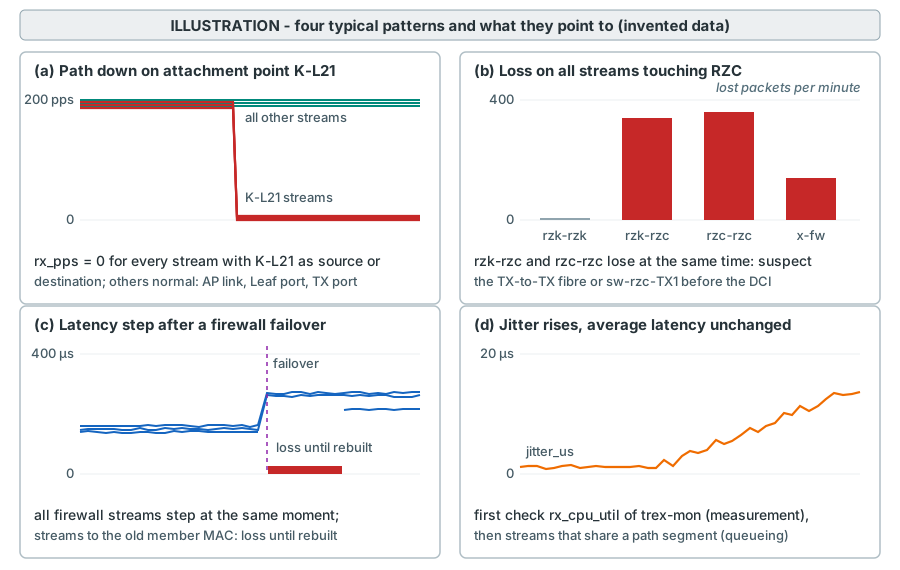
(a) Path down on one AP. All streams that have K-L21 as source or destination drop to rx_pps = 0 at the same
moment, in every class and VLAN; all other streams are untouched. The common element is the attachment point: the
10G link between sw-rzk-TX1 and sw-rzk-L21, the QinQ access port on the TX switch, or the service instances on the
Leaf port. If only the L3 streams of an AP are down while its L2 streams run, suspect gateway resolution (for a Leaf AP
also the centralised-gateway caveat of chapter 6) or a firewall rule instead
(chapter 25).
(b) Loss on all RZC streams. Streams of dc_pair rzk-rzc and rzc-rzc lose packets together, rzk-rzk streams do
not. Every frame to or from an RZC attachment point crosses the TX-to-TX fibre and sw-rzc-TX1, so this pattern
points first to the measurement infrastructure. A DCI problem looks different: rzk-rzc streams and every L3-BL
stream with an RZC endpoint suffer (the gateway is on sw-rzk-BL, so a routed stream between an RZC and an RZK AP
crosses the DCI once, one between two RZC APs twice), as do firewall streams whose path crosses the DCI to the active
member, while
intra-RZC L2 streams (rzc-rzc) stay clean. Check sw-rzc-TX1 and the TX-to-TX link before raising a production
incident.
© Latency step after a firewall failover. All streams through the firewall change their latency at the same
moment, usually with a short burst of loss, while the L2 and L3-BL streams do not change. If the cluster is stretched
across both data centres (as the configuration suggests; to be confirmed with the firewall team), a failover moves the
active member to the other site, and the size of the step depends on the pair. With firewall-zone option B, the RZK
pairs of the Enterprise-firewall streams (K-L11 and K-BL with the zone client at K-BL) cross the DCI twice more while
CPF-ZV02 in RZC is active, whereas the RZC pairs (C-L21 and C-BL with the zone client at C-BL) cross it twice in either
state - the VLAN 1314 gateway is on sw-rzk-BL only - and move much less. The DC-firewall streams of RZK and RZC
pairs shift in opposite directions (chapter 15).
A second effect of a failover depends on the cluster MAC. In February 2025 both clusters answered with member MACs - no
virtual MAC was seen. Streams whose destination MAC is the firewall itself - both directions of L3-DCFW and the reverse
L3-ENTFW and DSCP streams of the zone clients 10.9.90.106 (K-BL) and 10.9.90.113 (C-BL) - then keep sending to the
former active member and lose packets until they are rebuilt with the newly resolved MAC. trexctl's gateway-MAC tracker
polls the resolved gateway MACs every 10 s, rebuilds these streams and writes a gateway_mac_changed event, which
appears in the event list and raises the Gateway MAC changed alert (chapter 18). How long the
gap lasts depends on how ClusterXL announces the new MAC: EMU learns it at once from a gratuitous ARP request, ignores
an ARP reply sent to the broadcast address and otherwise waits for its next periodic query, every 60 s by default. The
plan's target of recovery within 15 s therefore needs a shorter ARP timer for the firewall VLANs or a forced query
confirm on device. Until trexctl exists, read the new dgw.rmac with
emu_show_client_info - if it still shows the old MAC, force a query with emu_arp_cmd_query ... --garp off - and
re-add the affected streams by hand. Their latency panels show a gap meanwhile, and if the rebuild takes longer than
the rule timing, Stream loss and Path down fire for them. The forward L3-ENTFW streams (VLAN 1314 to the zone, sent to
the gateway MAC of sw-rzk-BL) recover by themselves. Confirm in the firewall cluster state and logs, add an
annotation, and decide whether the new latency level is the new normal (then re-baseline those streams) or a state to
be reverted. Record this signature once during a planned failover.
(d) Jitter increase. jitter_us rises while lat_avg_us barely moves. First rule out the measurement: look at
the RX core CPU on Ports and server - an overloaded software RX core adds variable delay to every stream. If it is
calm, find the streams that share a path segment with the affected ones; growing jitter with stable average latency
typically means queues that fill and drain, for example on a link close to congestion.
Key Flux queries
The queries below implement the key panels. They follow the data model of chapter 8 and the Flux and Grafana documentation; validate on the bench each one against real data while building the dashboards.
from(bucket: "trex")
  |> range(start: -5m)
  |> filter(fn: (r) => r._measurement == "trex_stream" and r.instance == "trex-mon" and r._field == "drop_pkts")
  |> group(columns: ["pg_id"])
  |> max()
  |> map(fn: (r) => ({r with _value: if r._value > 0 then 1 else 0}))
  |> group()
  |> sum()
Mapping each stream to 1 or 0 before summing returns 0 when all is well. A query that simply counted dropping streams would return no data in the healthy case, and an empty stat panel cannot be told apart from a dead exporter.
from(bucket: "trex")
  |> range(start: -30s)
  |> filter(fn: (r) => r._measurement == "trex_stream" and r.instance == "trex-mon")
  |> filter(fn: (r) => r._field == "rx_pps" or r._field == "tx_pps")
  |> group(columns: ["pg_id", "_field"])
  |> max()
  |> group(columns: ["pg_id"])
  |> pivot(rowKey: ["pg_id"], columnKey: ["_field"], valueColumn: "_value")
  |> map(fn: (r) => ({r with _value: if r.rx_pps == 0.0 and r.tx_pps > 0.0 then 1 else 0}))
  |> group()
  |> sum()
from(bucket: "trex")
  |> range(start: v.timeRangeStart, stop: v.timeRangeStop)
  |> filter(fn: (r) => r._measurement == "trex_stream" and r.kind == "latency" and r._field == "lat_avg_us")
  |> filter(fn: (r) => r.class == "${class}" and r.src_vlan == "${vlan}" and r.dscp == "${dscp}")
  |> group(columns: ["src_ap", "dst_ap"])
  |> mean()
  |> group()
  |> pivot(rowKey: ["src_ap"], columnKey: ["dst_ap"], valueColumn: "_value")
The maximum matrix is the same query with r._field == "lat_max_us" and max() instead of mean(). Never build it
from lat_total_max_us (the lifetime maximum, which only grows) or from lat_last_max_us (TRex's last_max, the
maximum of the last 0.5-second window only, stored for reference). The final group() merges all cells into one table
before pivot(), so the table panel receives one frame; the column order is then set with the Organize fields by
name transformation.
from(bucket: "trex")
  |> range(start: v.timeRangeStart, stop: v.timeRangeStop)
  |> filter(fn: (r) => r._measurement == "trex_stream" and r._field == "drop_pkts")
  |> filter(fn: (r) => r.class =~ /^${class:regex}$/ and r.dc_pair =~ /^${dc_pair:regex}$/)
  |> aggregateWindow(every: 1m, fn: sum, createEmpty: false)
The outage table uses the pivot() and map() query of chapter 8 with
v.timeRangeStart/v.timeRangeStop instead of fixed times.
data = from(bucket: "trex")
  |> range(start: v.timeRangeStart, stop: v.timeRangeStop)
  |> filter(fn: (r) => r._measurement == "trex_stream" and r.kind == "latency" and r.class == "${class}")
  |> filter(fn: (r) => r.src_ap =~ /^${src_ap:regex}$/ and r.dst_ap =~ /^${dst_ap:regex}$/)

data
  |> filter(fn: (r) => r._field == "lat_avg_us")
  |> aggregateWindow(every: v.windowPeriod, fn: mean, createEmpty: false)
  |> yield(name: "avg")

data
  |> filter(fn: (r) => r._field == "lat_max_us")
  |> aggregateWindow(every: v.windowPeriod, fn: max, createEmpty: false)
  |> yield(name: "max")
from(bucket: "trex")
  |> range(start: v.timeRangeStart, stop: v.timeRangeStop)
  |> filter(fn: (r) => r._measurement == "trex_stream" and r.kind == "latency" and r._field == "lat_avg_us")
  |> filter(fn: (r) => r.class == "DSCP" and r.src_ap == "${src_ap}" and r.dst_ap == "${dst_ap}")
  |> group(columns: ["dscp"])
  |> aggregateWindow(every: v.windowPeriod, fn: mean, createEmpty: false)
Filtering on class == "DSCP" alone is enough, because the BE reference belongs to the group; a filter on
dscp == "BE" would also pull in the regular 128-byte L3-ENTFW stream of the firewall pair, which is not comparable.
For the heatmap in Class detail, query the hist_* fields of one stream with aggregateWindow(..., fn: sum),
rename the series to their numeric bucket keys (Rename by regex hist_(.*) to $1), and set the heatmap to
Calculate from data: No with tick alignment Bottom (GE), because the keys are lower bucket bounds.
Alert rules
All rules are Grafana-managed, live in the folder TRex and carry the label team=trex plus a severity. Two
evaluation groups keep fast and slow rules apart: trex-fast every 10 seconds, trex-slow every minute. Alert rules
cannot use dashboard variables, so every query below is written out in full.
| Rule | Group | Query and condition | Pending | No Data / Error | Severity |
|---|---|---|---|---|---|
| Stream loss | fast | drop_pkts per stream, last 30 s; Reduce Sum; Threshold > 0 |
30 s | Normal / Keep last state | warning |
| Path down | fast | A rx_pps, B tx_pps per stream, last 10 s; C = Max(A), D = Mean(B); Math $C == 0 && $D > 0 |
30 s | Normal / Keep last state | critical |
| Latency degradation | slow | A lat_avg_us (kind=latency) last 1 min, Mean; B per-stream threshold from the baseline; Math $A > $B |
2 min | Normal / Keep last state | warning |
| Gateway MAC changed | fast | trex_event points with kind == "gateway_mac_changed", last 1 min, counted in the query (count()); Reduce Last; Threshold > 0 |
0 | Normal / Keep last state | info |
| Jitter | slow | A jitter_us last 1 min, Mean; B = 10 x baseline jitter; Math $A > $B |
2 min | Normal / Keep last state | info |
| TRex instance / exporter down | fast | trex_global of trex-mon, last 60 s; Reduce Count; Threshold < 1 |
0 | Alerting / Alerting | critical |
| Unresolved EMU clients | slow | unresolved_clients of trex-mon, last 1 min; Reduce Last; Threshold > 0 |
5 min | Normal / Keep last state | warning |
| Budget | slow | L = number of latency streams, F = number of flow-stat streams, P = total tx_pps; Math: logical OR of $L > 120, $F > 600, $P > 50000 |
5 min | Normal / Keep last state | warning |
What each rule really means
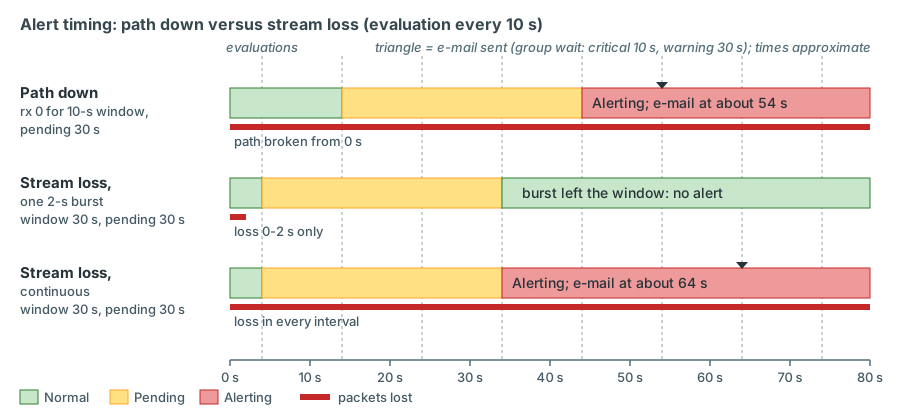
- Stream loss reports persistent or recurring loss: the 30-second sum must stay above zero for 30 seconds of evaluations. A single burst - a failover, one lost packet - is recorded on the Loss dashboard but sends no e-mail, because the burst leaves the 30-second window before the pending period ends. Continuous loss (a faulty optic dropping 0.1 % of all frames) fires after about half a minute. If LVR wants an e-mail for every loss event, a second rule with a 2-minute window and pending period 0 does that - at the price of mails for every planned failover.
- Path down fires when a stream has sent but received nothing for the whole 10-second window, and that stays true for 30 seconds: about 40-50 seconds after the break. It works for both kinds of stream. It is the rule that catches a broken attachment point, a missing VLAN on a Leaf port, a missing firewall rule, an unresolved gateway or a stream that still carries the MAC of the former active firewall member.
- Latency degradation compares the last minute's average latency of each latency stream with its own threshold, derived from the baseline (next section); two minutes above it fire the alert. Average, not maximum: the interval maximum of a single packet is too noisy for an e-mail - look at it on the dashboards.
- Gateway MAC changed is informational: trexctl's gateway-MAC tracker found a new gateway MAC in a tracked VLAN - normally a firewall failover - and rebuilt the affected streams (chapter 18). The rule fires at the first evaluation that sees the event and resolves once the event has left the one-minute window. It explains a loss burst on the firewall classes at the same moment. A failover reported by the firewall team without this event usually means that the cluster kept its MAC (a virtual MAC) or that EMU has not learned the new MAC yet - see pattern © above.
- Jitter is informational: rising jitter alone rarely needs immediate action, but it is an early hint.
- TRex instance / exporter down fires through its No Data setting: when no
trex_globalpoint arrived for 60 seconds - exporter stopped, TRex instance stopped, or both - the query returns no data and the rule goes to Alerting. If InfluxDB itself fails, the query errors and the Error setting (Alerting) reports that too. Its threshold (count below 1) can never be met with data; it exists only to make the rule complete. - Unresolved EMU clients means that some TRex client cannot resolve its gateway by ARP for 5 minutes: a VLAN is missing on an AP port, a firewall interface is down, the gateway changed its address, or - for clients behind Leaf APs - the centralised-gateway caveat of chapter 6. The 5-minute pending period also rides through a reload of the EMU profile, which removes and re-creates every client.
- Budget guards against an accidentally large profile: more than 120 latency streams (the hard limit is 128),
more than 600 flow-stat streams (hard limit 1 023 in software mode) or more than 50 000 pps in total - as one Math
expression
$L > 120 || $F > 600 || $P > 50000on three single numbers. The default profile uses 74 latency streams, 102 flow-stat streams and about 20.6 kpps, so the rule stays quiet unless a profile change goes far beyond it. The fourth guard rail of chapter 16 - at most 100 pps per stream through a firewall - is a property of each stream definition and belongs in the orchestrator's validation when a profile is applied.
No Data and Error handling
The per-stream rules use No Data = Normal: a broken path is not "no data" (the exporter writes rx_pps = 0), and
if the exporter stops, one dedicated rule reports it instead of every other rule raising its own DatasourceNoData
alert (an alert that was already firing then resolves, and its notification carries grafana_state_reason "No Data").
Error = Keep last state keeps a short InfluxDB hiccup from resolving and re-firing every open alert; a
longer InfluxDB failure is reported by the exporter-down rule. A disappearing stream (removed from the profile)
resolves its open alerts after two evaluations as "MissingSeries" - expected after a profile change. The same happens
in the latency and jitter rules to a stream that receives nothing: the exporter writes no latency fields for intervals
without received packets, so the stream drops out of their query results, and the path-down rule reports the outage
instead. The Gateway MAC changed rule has no data in its normal state - no event in the last minute - so it uses
No Data = Normal as well.
Grouping and notification
Alert instances carry the stream tags as labels (pg_id, name, class, dc_pair, src_ap, dst_ap). The
notification policy for team=trex groups by alertname, class and dc_pair: when a Leaf fails and twenty streams
go down, the network team receives one e-mail per class and DC pair listing all affected streams, not twenty mails.
Critical alerts get a shorter group wait. One contact point, Email, sends to the network team's distribution list
(the plan mentions an optional webhook to the existing monitoring system as a later addition).
apiVersion: 1
contactPoints:
  - orgId: 1
    name: lvr-netzwerk-email
    receivers:
      - uid: lvr_netzwerk_email
        type: email
        settings:
          addresses: $TREX_ALERT_EMAIL
          singleEmail: true
policies:
  - orgId: 1
    receiver: lvr-netzwerk-email
    group_by: ['grafana_folder', 'alertname']
    routes:
      - receiver: lvr-netzwerk-email
        object_matchers:
          - ['team', '=', 'trex']
        group_by: ['alertname', 'class', 'dc_pair']
        group_wait: 30s
        group_interval: 5m
        repeat_interval: 4h
        mute_time_intervals: ['lvr-weekly-maintenance']
        routes:
          - receiver: lvr-netzwerk-email
            object_matchers:
              - ['severity', '=', 'critical']
            group_wait: 10s
            repeat_interval: 1h
            mute_time_intervals: ['lvr-weekly-maintenance']
      - receiver: lvr-netzwerk-email
        object_matchers:
          - ['alertname', '=~', 'DatasourceError|DatasourceNoData']
        group_by: ['alertname', 'datasource_uid']
muteTimes:
  - orgId: 1
    name: lvr-weekly-maintenance
    time_intervals:
      - times:
          - start_time: '20:00'
            end_time: '23:00'
        weekdays: ['thursday']
        location: 'Europe/Berlin'
sketch - validate on the bench keys follow the Grafana alerting file-provisioning reference. The address comes from an environment variable; the weekly window is an illustrative values example for a recurring maintenance slot, if LVR has one. Remember that provisioning the policy tree replaces the whole tree.
The rules themselves are best built in the Grafana UI, checked in the rule preview against live data, then exported as YAML into git. The exported path-down rule will look roughly like this:
apiVersion: 1
groups:
  - orgId: 1
    name: trex-fast
    folder: TRex
    interval: 10s
    rules:
      - uid: trex-path-down
        title: TRex path down
        condition: E
        for: 30s
        noDataState: OK
        execErrState: KeepLast
        labels: {team: trex, severity: critical}
        annotations:
          summary: 'Path down: {{ $labels.src_ap }} -> {{ $labels.dst_ap }} ({{ $labels.class }})'
        data:
          - refId: A
            relativeTimeRange: {from: 10, to: 0}
            datasourceUid: influx-trex
            model:
              refId: A
              query: |
                from(bucket: "trex")
                  |> range(start: v.timeRangeStart, stop: v.timeRangeStop)
                  |> filter(fn: (r) => r._measurement == "trex_stream" and r.instance == "trex-mon" and r._field == "rx_pps")
                  |> keep(columns: ["_time", "_value", "pg_id", "name", "class", "dc_pair", "src_ap", "dst_ap"])
          - refId: B
            relativeTimeRange: {from: 10, to: 0}
            datasourceUid: influx-trex
            model:
              refId: B
              query: |
                from(bucket: "trex")
                  |> range(start: v.timeRangeStart, stop: v.timeRangeStop)
                  |> filter(fn: (r) => r._measurement == "trex_stream" and r.instance == "trex-mon" and r._field == "tx_pps")
                  |> keep(columns: ["_time", "_value", "pg_id", "name", "class", "dc_pair", "src_ap", "dst_ap"])
          - refId: C
            datasourceUid: __expr__
            model: {refId: C, type: reduce, expression: A, reducer: max, settings: {mode: dropNN}}
          - refId: D
            datasourceUid: __expr__
            model: {refId: D, type: reduce, expression: B, reducer: mean, settings: {mode: dropNN}}
          - refId: E
            datasourceUid: __expr__
            model: {refId: E, type: math, expression: '$C == 0 && $D > 0'}
sketch - export the real rule from Grafana noDataState: OK is the file
representation of "Normal"; KeepLast of "Keep last state". keep() gives A and B exactly the same labels, so Math
can pair each stream's RX and TX series.
Maintenance windows
Planned work on the fabric produces exactly the events the platform is built to detect. The procedure keeps the measurement running and the mailboxes quiet:
- Before the window create a silence in Grafana (Alerting > Silences) for the expected duration, matching
the affected streams by label - for example
src_ap=K-L21and a second silence fordst_ap=K-L21for work onsw-rzk-L21, ordc_pair=~rzk-rzc|rzc-rzcfor work on the DCI. Silences have a fixed end, so they cannot be forgotten. Mute timings are only for recurring windows. - Annotate the start:
trexctl annotate "Maintenance: sw-rzk-L21 IRF member 2 reboot (CHG-...)"once trexctl exists; until then a manual Grafana annotation (Ctrl/Cmd + click) or atrex_eventline written withinflux write. - If convergence times must be measured precisely, raise the rate of the affected stream groups beforehand (chapter 23). Latency streams ignore the multiplier: their rate changes only by removing and re-adding them, which restarts their counters - annotate both changes.
- After the work annotate the end, check the outage table for the window, expire the silence early if the work finished early, and attach the outage table to the change ticket.
Evaluation continues during silences: alert state history and dashboards keep the full record of what happened.
Baseline and thresholds
Thresholds cannot be guessed - the platform has never measured these paths. The procedure is a 7-day baseline after bring-up (chapter 21), with notifications for the latency rules enabled only afterwards:
- Run the full monitoring profile for 7 days without changes; annotate start and end; note known incidents.
-
Compute per latency stream the median and the 99th percentile of the 1-minute averages, and the median of the jitter, from
trex_longtermvalidate on the bench:Flux - baseline per stream (example week)from(bucket: "trex_longterm") |> range(start: 2026-11-02T00:00:00Z, stop: 2026-11-09T00:00:00Z) |> filter(fn: (r) => r._measurement == "trex_stream" and r.kind == "latency" and r._field == "lat_avg_us") |> group(columns: ["class", "dc_pair", "name"]) |> quantile(q: 0.5, method: "estimate_tdigest")Run it with
q: 0.99for the 99th percentile and with_field == "jitter_us"for the jitter median. 3. Check plausibility: streams of the same class and pair type should be close; intra-RZC higher than intra-RZK by the TX fibre; inter-DC dominated by fibre delay. Investigate outliers before accepting them; exclude incident periods by narrowing the range. 4. Derive thresholds - starting values, to be tuned:Class / pair type Latency threshold (1-minute average) L2 intra-DC, L3-BL 3 x median, but at least 1.5 x p99 L2 inter-DC 2 x median (the baseline is mostly fibre delay, so a factor 2 is already a large change), at least 1.5 x p99 L3-DCFW, L3-ENTFW, DSCP through the firewall 3 x median, at least 1.5 x p99; in addition an absolute ceiling of 2 ms Jitter (all latency streams) 10 x median jitter -
Document the baseline table (median, p99, threshold per stream or pair type) in the operations handbook, enable the notifications, and review the thresholds monthly and after every accepted change (for example a new firewall member location).
Open decision: how the alert rules get the per-stream thresholds
- Rolling baseline in the rule. Query B computes the 7-day median from
trex_longtermat every evaluation. Pro: no extra data, new streams are covered automatically after a few days. Con: a lasting degradation becomes the new normal once it covers half of the window (about 3.5 days with a median); a 7-day query every minute costs some CPU. - Frozen baseline stored once. After the baseline week a Flux script writes the per-stream thresholds with
to()into a small measurement (for exampletrex_baselineintrex_longterm); query B reads the latest value. Pro: stable, explicit, reviewable, cheap. Con: an extra measurement and a procedure to re-run after changes; new streams have no threshold until it is re-run (the rule silently skips them - Grafana warns that series were dropped from the union). - Fixed thresholds per class and pair type written into the rules. Pro: simplest, fully visible in git. Con: coarse - one threshold must fit all streams of a class, including the longer intra-RZC paths.
Provisioning dashboards and rules from git
With trexctl (planned). The trexctl repository (/opt/trexctl, chapter 18) contains
dashboards/*.json and alerts/*.yaml next to the inventory and profiles. Grafana's dashboard provider points to
/opt/trexctl/dashboards with allowUiUpdates: false; the alerting files are linked or copied into
/etc/grafana/provisioning/alerting/. A change is a commit with the ticket number, reviewed like any configuration
change; deployment is a git pull on the server followed by a provisioning reload. Stream tags are generated by
trexctl from the inventory, so new APs or classes appear in the variable lists without editing dashboards.
Without trexctl (day one). Nothing in Grafana depends on trexctl:
- Build the data sources from the provisioning file of chapter 9.
- Build each dashboard in the UI of Grafana, then export it as JSON (Classic model if Grafana 12.4 must load it)
and store it in a git repository on the server, for example
/opt/trex-grafana/dashboards/. - Point a dashboard provider to that directory, switch it to
allowUiUpdates: false, and from then on change dashboards only through git. -
Create the alert rules, contact point, policy tree and mute timings in the UI, test them, export them as YAML (Alerting > ... > Export), store them in git and in
/etc/grafana/provisioning/alerting/, then delete the UI-created originals (importing a resource that already exists causes a conflict) and reload:Reload provisioned resources (Grafana server administrator)curl -X POST --user admin https://trex-rzk-01.<domain>/api/admin/provisioning/dashboards/reload curl -X POST --user admin https://trex-rzk-01.<domain>/api/admin/provisioning/alerting/reloadverified endpoints from the Grafana Admin HTTP API reference; a restart of
grafana-serverhas the same effect.
Key takeaways
- Eight dashboards: Overview as the entry point; Latency matrix, Loss and outages, Class detail and DSCP for the network; Ports and server for the measurement system; Lab tests and ASTF for on-demand tests.
- Latency panels show only latency streams (
kind=latency, 74 streams); flow-stat streams (102) contribute loss only. - Read latency as mean of
lat_avg_usplus maximum oflat_max_us(interval maximum, bucket resolution) - neverlat_total_max_usorlat_last_max_us(TRex'slast_max, stored for reference only). - Which streams are affected localises the fault: one AP, all RZC streams (measurement path), all firewall streams. After
a firewall failover, streams sent to a firewall member MAC lose packets until the gateway-MAC tracker has rebuilt
them; the
gateway_mac_changedevent and the informational Gateway MAC changed alert mark the moment. Recovery within the plan's 15 s depends on how ClusterXL announces the new MAC and is still to be confirmed. - Stream loss reports persistent loss, path down a total outage after about 40-50 s; short events are reviewed on the Loss dashboard.
- No Data is Normal for per-stream rules and Alerting for the dedicated exporter-down rule.
- Notifications are grouped by alert, class and DC pair; silences cover ad-hoc maintenance, mute timings recurring windows; annotations document both.
- Thresholds come from a 7-day baseline and are reviewed monthly; how they are stored is an open decision.
- Dashboards and alert rules live in git and are provisioned; the UI is for building and testing, not for production changes.
Check your understanding
1. The Overview shows 'Path down: 6'. On the Loss dashboard all six streams have K-L31 as source or destination. Where do you look first, and why?
At the attachment point K-L31: the 10G link between sw-rzk-TX1 and sw-rzk-L31, the QinQ access port on the TX
switch and the service instances on the Leaf port. Only streams that use this AP are affected, in every class, so
the common element is the AP itself, not the fabric or a firewall.
2. All rzk-rzc and rzc-rzc streams lose packets, rzk-rzk streams are clean. A colleague wants to open an incident for the DCI. What do you reply?
The rzc-rzc L2 streams do not cross the DCI, but every RZC stream crosses the TX-to-TX fibre and sw-rzc-TX1. The
pattern therefore points to the measurement path first. A DCI problem would hit rzk-rzc streams and every L3-BL
stream with an RZC endpoint (once between an RZC and an RZK AP, twice between two RZC APs, because the gateway is on
sw-rzk-BL) but leave intra-RZC L2 streams clean. Check the TX switch and the TX-to-TX link before raising a
production incident.
3. A firewall failover causes 3 seconds of loss on the L3-ENTFW streams from VLAN 1314 to the zone. Why did nobody receive a stream-loss e-mail, and is that a fault?
The stream-loss rule needs the 30-second sum to stay above zero for a 30-second pending period. A single short
burst leaves the window before the pending period ends, so the instance goes back to Normal - by design, the rule
reports persistent loss. The event is fully recorded on the Loss and outages dashboard. If LVR wants mail for every
loss event, an additional rule with a longer window and pending period 0 can be added. Check the reverse direction
as well: the streams of the zone clients 10.9.90.106 and 10.9.90.113 are sent to the firewall's member MAC and keep
losing packets until the gateway-MAC tracker has rebuilt them with the new MAC - the gateway_mac_changed event
shows when. If EMU has to wait for its next periodic ARP query (every 60 s by default), that takes long enough for
stream loss and path down to fire for them.
4. The exporter crashed at 03:10. Which alerts do you expect, and why not dozens of them?
Only "TRex instance / exporter down": its query finds no trex_global point for 60 seconds, and its No Data state is
set to Alerting. The per-stream rules also see no data, but their No Data state is Normal, so they neither fire nor
raise DatasourceNoData alerts. One e-mail names the real cause.
5. Why does the latency matrix not use lat_total_max_us for its maximum cells?
lat_total_max_us is TRex's lifetime maximum: after the first spike after a restart it never decreases, so every
later time range would show the same old value. The matrix uses lat_max_us, the maximum of each 2-second
interval, aggregated with max() over the selected time range.
6. On Thursday at 22:00 sw-rzk-L21 is rebooted. Write down the steps on the TRex side.
Create silences for src_ap=K-L21 and dst_ap=K-L21 covering the window; annotate the start (trexctl annotate
later, a manual Grafana annotation or an influx write of trex_event now); optionally raise the stream rate for
higher resolution; after the work annotate the end, read the outage table for the window, attach it to the change
ticket and expire the silences.
7. The DSCP dashboard shows EF 30 µs above BE for K-L11 to the firewall zone, but no difference for K-L11 to C-L21. What does that suggest?
The fabric applies no QoS scheduling, so the L2 pair shows no difference, as expected. A difference on the firewall path means a device on that path treats EF differently - most likely the firewall (queueing or inspection by class). Before concluding, check the RX core CPU (measurement artefact). Frame size and path cannot explain it: the BE reference is the same stream with TOS 0x00 - same pair, 256-byte frames, same rate.
8. Somebody wants to lower the stream-loss threshold by editing the rule in the Grafana UI, but the rule cannot be edited. Why, and what is the correct way?
The rule is provisioned from a file, and file-provisioned alerting resources cannot be edited in the UI. Change the YAML in git (or test the change on a UI-created copy and export it), commit with the ticket number, deploy the file and reload the alerting provisioning.
References
- Plan document v0.92 (14 October 2026), sections 9.5 (gateway-MAC tracker), 10.4 (dashboards, example Flux queries), 10.5 (alert rules), 11.2 (baseline procedure), 11.8 (DSCP), 11.10 (convergence measurement), 12.3 (acceptance: recovery after a firewall failover).
- Chapter 16 (stream matrix, rates, budgets), Chapter 14 (paths and fibre offsets), Chapter 18 (exporter, trexctl), Chapter 23.
- Grafana documentation, https://grafana.com/docs/grafana/latest/ - Alert rule evaluation, Queries and conditions, Expression queries, No Data and Error states, Stale alert instances, Group alert notifications, Notification policies, Mute timings and active time intervals, Configure silences, Use configuration files to provision alerting resources, Export alerting resources, HTTP API - Admin, Provision Grafana, Heatmap, Transform data, Variable syntax.
- Grafana source,
pkg/services/ngalert/models/alert_rule.go(NoDataStateandExecutionErrorStatevalues includingKeepLast),pkg/expr/commands.goandpkg/expr/threshold.go(expression model keys). - Flux standard library -
aggregateWindow(),group(),pivot(),map(),quantile(),keep(),yield(). - TRex Stateless Python API,
get_pgid_stats(); TRex stateless guide, "Per stream latency/jitter/packet errors" (limit of 128 latency streams).