5. Counting packets and measuring latency
In this chapter
You will learn
- why port counters cannot tell you the loss of one path, and what flow statistics add
- how TRex marks and counts flow-stat packets, in hardware and in software, and where the limits are
- how a latency stream carries a 16-byte signature and how TRex turns it into latency, jitter, loss and reordering
- why trex-mon runs in software mode and trex-lab in hardware mode, and what that means for the monitoring design
- how to read
get_pgid_statscorrectly: average, maxima, jitter, histogram and error counters - how to compute loss and interval maxima correctly when an exporter polls every 2 seconds
- how accurate the numbers are and which fixed offsets are part of every LVR measurement
A monitoring platform produces numbers, and a support engineer is only as good as their understanding of where each number comes from: which core counted it, at which moment, over which time window, and what it silently leaves out. This chapter follows a packet from the moment TRex marks it to the moment a dictionary with its statistics arrives in Python. With that knowledge you can tell a real fabric problem from an artefact of the measurement - the most frequent question you will get once Grafana is in front of the network team.
Port counters and why they are not enough
Every TRex port keeps the classic counters, shown by stats -p in the console and returned per port by
get_stats() in Python:
| Counter | Meaning |
|---|---|
opackets / obytes |
packets and bytes transmitted by the port |
ipackets / ibytes |
packets and bytes received by the port |
oerrors / ierrors |
transmit and receive errors reported by the NIC (for example frames with a bad FCS) |
tx_pps, rx_pps, tx_bps, rx_bps, tx_bps_L1, rx_bps_L1, tx_util, rx_util |
rates derived from the counters |
They count everything that crosses the port: all streams of all classes, EMU's ARP and ICMP, and every production
frame that the TX switch floods towards TRex. On trex-mon about 176 streams leave through p0 and p1, and their return
traffic arrives on whichever trunk port the TX switch has learned for the destination client. The difference between
opackets of one port and ipackets of another therefore says nothing about any single path. The TRex tutorial
computes loss exactly that way - in a back-to-back lab with one flow, where it is correct.
Port counters remain useful as a sanity check: ierrors reveals a bad optic or DAC on a TRex link, and the rates show
whether the ports carry what the profile promises. For per-path answers you need flow statistics.
Flow statistics: counting per stream
pg_id
A stream gets statistics when you attach STLFlowStats(pg_id=n) (loss only) or STLFlowLatencyStats(pg_id=n)
(loss plus latency). The pg_id is a 32-bit number you choose. Several flow-stat streams may share one pg_id - their
counters are then added up - but they must use the same L4 protocol. Latency streams need a unique pg_id each.
In the LVR platform
One stream = one pg_id, always. The plan fixes three ranges: latency streams of trex-mon 1-127, loss-only streams
of trex-mon 1000-1999, lab streams from 2000 upwards. Within the range of its kind, trexctl gives a new stream the
lowest free id and records the assignment in /data/trexctl/state/pgid-map.json (key: class, kind, source AP and VLAN,
destination AP and VLAN, TOS). The allocation must be stable: Grafana stores history per pg_id, so a pg_id that
is reused for a different path silently splices two paths into one graph - which is why that file belongs in the
nightly backup and is copied into the configuration repository whenever it changes.
How TRex marks a flow-stat packet
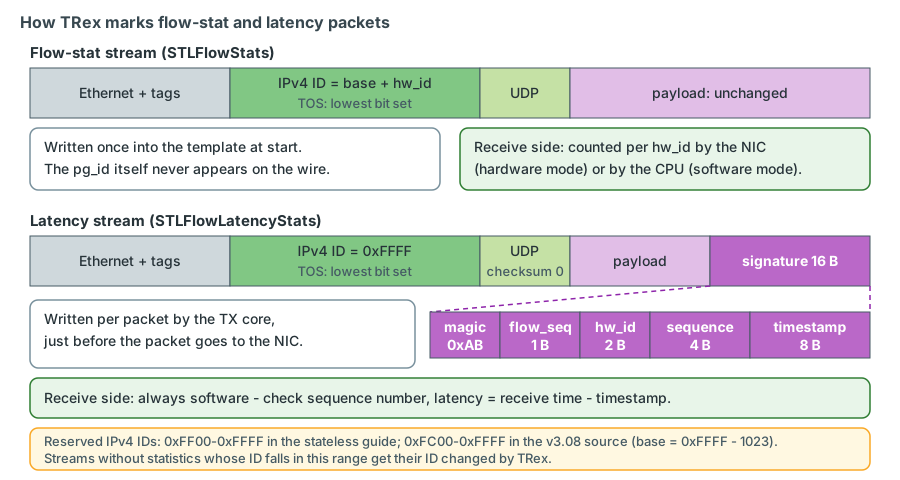
The pg_id itself never appears on the wire. When a stream starts, TRex allocates an internal counter index (the hw_id) for its pg_id and rewrites the stream template:
- The IPv4 identification field (for IPv6 the flow label) gets a value from a reserved range: base + hw_id. The
TRex stateless guide describes the reserved range as 0xff00-0xffff. In the current source (v3.08) the base is
0xFFFF - 1023= 0xFC00 for the X710 driver in both modes, so that 1023 software counters fit; treat 0xFC00-0xFFFF as reserved. - A stream without statistics whose template happens to carry an ID in the reserved range gets its ID changed, so that it can never be counted by mistake.
- TRex also sets the lowest bit of the IPv4 TOS byte on flow-stat and latency packets (
set_tos_to_cpuin the source). The DSCP - the upper six bits - is unchanged; a capture shows the ECN field as ECT(1), for example 0xB9 instead of 0xB8 for an EF stream. confirm with a capture on the bench - TRex adjusts the IPv4 header checksum for both changes. The rest of the packet, including the payload, stays as you built it.
Because the ID is written into the template once, a flow-stat stream costs nothing extra per packet on the transmit
side. The data-plane core that sends the packet counts it (tx_pkts, and tx_bytes including the 4-byte FCS).
Who counts on the receive side: hardware or software
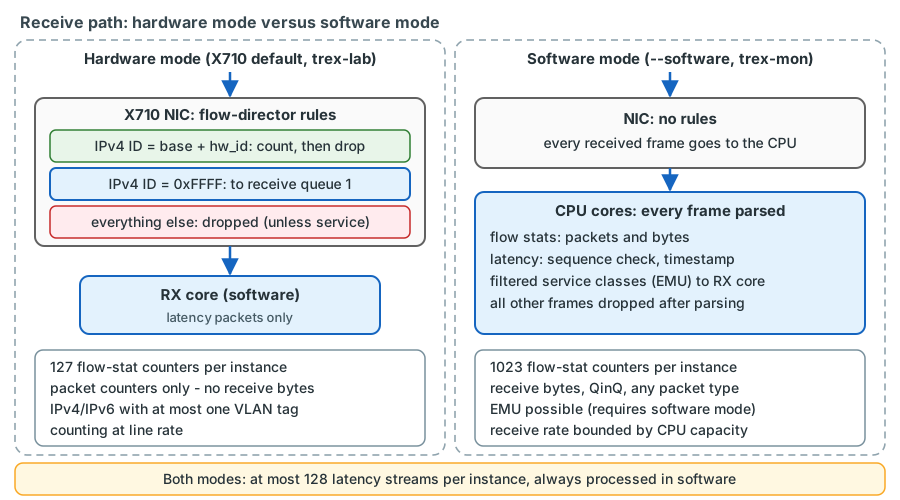
Hardware mode is the default for X710 ports in stateless mode. TRex programs one flow-director rule per active
hw_id into the NIC: "IPv4 ID = base + hw_id and this L4 protocol". The NIC counts every matching packet in its own
counter and then drops it - the packet never reaches a CPU core. This is how a single server checks millions of packets
per second per port. The price: the X710 counters count packets only, so receive byte counters and receive bit rates
show N/A, and the number of rules is limited.
Software mode (--software) programs no rules at all: "all RX packets will be processed by software" (TRex
manual, --software). A CPU core parses every received frame, reads the IPv4 ID and increments the packet and byte
counters of the matching hw_id. Software mode understands more packet types and supports more counters, but every
received packet costs CPU time, so the total receive rate is much lower. --no-hw-flow-stat keeps an X710 in hardware
mode but has its flow-stat packets counted in software - useful when receive byte counters are needed, at a lower
total rate (TRex manual, --no-hw-flow-stat).
The limits are documented in the stateless guide from TRex docs:
| NIC type | Max streams using HW filters | Using --software (from v2.23) |
|---|---|---|
| i350 | 255 | 1023 |
| x710 | 127 | 1023 |
| xl710 | 255 | 1023 |
| 82599 | 127 | 1023 |
| Mellanox | 127 | 127 |
| virtio/vmxnet/other virtual NICs (always software) | 1023 | 1023 |
Table 14 "Maximum concurrent streams for collecting flow statistics" (stateless guide, "Tutorial: Per stream
statistics"); the same values are in the source as MAX_FLOW_STATS 1023 and MAX_FLOW_STATS_X710 127.
Supported packet types for flow statistics (same section): IPv4 or IPv6 over Ethernet, with at most one VLAN tag.
"Beginning with version 2.21, QinQ (two vlan tags) is supported if using --software."
Latency streams
The 16-byte signature
A stream with STLFlowLatencyStats is handled differently. TRex sets its IPv4 ID to the constant 0xFFFF (plus the TOS
bit) and, for every single packet, the transmitting data-plane core writes 16 bytes into the last 16 bytes of the
payload, immediately before handing the packet to the NIC:
| Field | Size | Content |
|---|---|---|
| magic | 1 byte | 0xAB - "this is a TRex latency packet" |
| flow_seq | 1 byte | generation of the stream; distinguishes late packets of a previous run that used the same counter |
| hw_id | 2 bytes | internal latency counter index (0-127) |
| seq | 4 bytes | sequence number, +1 for every packet of the stream |
| time_stamp | 8 bytes | transmit time, read from the CPU's high-resolution tick counter |
(struct flow_stat_payload_header in src/stx/stl/trex_stl_fs.h; filled in update_node_flow_stat() in
src/main_dpdk.cpp.)
Why at the end of the packet, and why the CPU clock?
At the end, the signature is independent of the headers in front of it: two VLAN tags, VXLAN or MPLS do not change where it is. In software mode TRex even recognises latency packets by the magic alone when a device in the path has changed the IPv4 ID. The CPU clock solves the hardest problem of one-way delay measurement: the packet is timestamped when it leaves and when it arrives by the same machine, so no clock synchronisation (NTP, PTP) is needed, and the result is a true one-way latency rather than half a round trip.
What the receive side does
In hardware mode a NIC filter steers packets with IPv4 ID 0xFFFF to a dedicated receive queue served by the RX core;
in software mode the software sees every packet anyway - in trex-mon, which runs with one DP core per port pair
(c: 1, the one-queue model of chapter 3), the RX core reads the receive queues of the ports directly. For each
latency packet TRex then:
- reads the last 16 bytes and checks the magic and the hw_id (in hardware mode garbage increments
bad_hdr; in software mode, where every packet is checked this way, a packet without a valid signature is simply not a latency packet); - checks the flow_seq - a late packet of the previous run on this counter increments
old_flowand is ignored; - compares the sequence number with the expected one and updates the error counters;
- computes
latency = now - time_stampand adds it to the histogram, the average, minimum, maximum and jitter.
The animation follows one latency stream (pg_id 17) at 200 pps. Watch the TX core write the signature into the end of
the payload just before transmission, the packet return on another TRex port where the RX core computes
latency = RX time - TX time, packet 42 get lost in the network, and packet 43 arrive: the RX core counts the gap as
dropped +1 and seq_too_high +1 and still records the latency of packet 43.
Sequence checking and the error counters
The error counters come straight from the sequence numbers. The API reference defines them from TRex docs:
| Key | Meaning |
|---|---|
dropped |
How many packets were dropped (estimation) |
dup |
How many packets were duplicated |
out_of_order |
How many packets we received out of order |
seq_too_high |
How many events of packet with sequence number too high we saw |
seq_too_low |
How many events of packet with sequence number too low we saw |
"We decide what went wrong only according to sequence number of last packet received and that of the previous packet.
seq_too_low and seq_too_high count events we see. dup, out_of_order and dropped are heuristics" - with these
scenarios (API reference, get_pgid_stats):
- Packet 10, then packet 10 again:
dup+1 andseq_too_low+1. - Packet 10, then packet 15: TRex assumes 4 packets were lost -
dropped+4,seq_too_high+1, next expected is 16. - Continuing scenario 2, packet 11 arrives:
seq_too_low+1,out_of_order+1,dropped-1 (one of the "lost" packets has arrived late).
In the LVR platform
For latency streams, dropped is the most direct loss indicator: it is based on sequence numbers, so it does not
depend on when counters were read, and it reacts with the next packet that arrives after a gap. During a link
failure a 200 pps stream that loses 300 packets shows dropped +300 as soon as the path is back - an outage of
300 / 200 = 1.5 s (chapter 23). dup should stay at zero; duplicates point to flooding (see Pitfalls).
Rules and limits for latency streams
The stateless guide lists the limitations ("Tutorial: Per stream latency/jitter/packet errors"), confirmed by the source:
- At most 128 concurrent latency streams per TRex instance, "in addition to the streams which collect per stream
statistics" (source:
MAX_FLOW_STATS_PAYLOAD 128insrc/trex_defs.h). Each needs its own receive state: sequence tracking, histogram, jitter. - Each latency stream needs a unique pg_id, and the same latency stream cannot be sent from two ports in parallel ("For payload rules: Can't have two streams with same pg_id, or same stream on more than one port").
- The packet needs at least 16 bytes of payload.
- One rule follows from how the signature is written: build latency packets with UDP checksum 0
(
UDP(..., chksum=0), "no checksum", legal for IPv4). The TX core writes the signature into every packet without recomputing the UDP checksum, so a checksum calculated by Scapy is wrong on the wire, and a firewall that verifies it may drop the packet (chapter 4) confirm firewall behaviour on the bench. - The global multiplier does not apply (chapter 4); to change the rate, remove the stream and add it again.
- Latency packets are always processed in software, even in hardware mode. "Do not make the total rate of latency streams higher than 5 MPPS"; a low rate is enough because "queues are built over time".
- Without
--softwarethe same packet types as for flow statistics apply (at most one VLAN tag).
Hardware mode versus software mode
| Hardware mode (X710, default) | Software mode (--software) |
|
|---|---|---|
| Who sees received packets | NIC filters: flow-stat packets are counted and dropped in the NIC; latency packets go to the RX core; everything else is dropped unless service mode is on | every received packet is processed by CPU cores |
| Flow-stat counters per instance | 127 | 1023 |
| Receive byte counters | no (N/A) |
yes |
| Packet types | IPv4/IPv6, at most one VLAN tag | all, including QinQ |
| Latency streams | up to 128, processed by the RX core; accurate with any c |
up to 128; accurate with one DP core per port pair (c: 1, one-queue model), not accurate with c of 2 or more (multi-queue model, chapter 3) |
| Receive capacity | line rate | limited by CPU - "total rate of RX streams is significantly lower" |
| EMU | not possible | required ("emu server should work in software mode, try adding --software") |
Why LVR runs two instances in two different modes
This is a decided design; the reasons are worth knowing by heart.
- trex-mon:
--software --emu. Three reasons, each sufficient on its own: the multiplexed ports carry double-tagged frames, which only software mode can count; software mode offers 1023 instead of 127 flow-stat counters; and EMU, which answers ARP for the TRex clients, only runs in software mode. The receive load is tiny (about 20 kpps), so the CPU cost does not matter. Withc: 1the RX core reads every received packet directly, which keeps the software latency measurement accurate. - trex-lab: hardware mode. Lab tests need line rate in both directions, which only NIC counting delivers. The
pinned lab ports send single-tagged frames, which hardware mode supports. 127 counters are plenty for a test,
latency streams work, and receive byte counters can be enabled with
--no-hw-flow-statwhen needed.
The design consequence for trex-mon
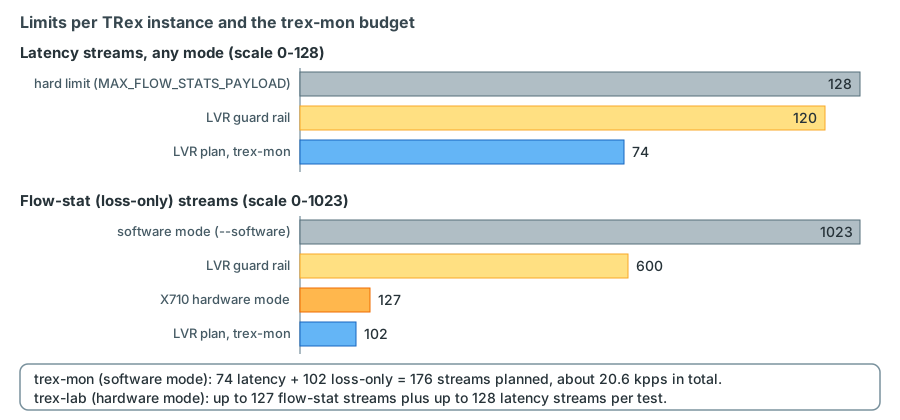
The 1023 counters of software mode apply to flow statistics. Latency streams are limited to 128 per instance no matter which mode. The monitoring profile therefore combines two kinds of streams (chapter 16 has the full budget):
- 74 latency streams (limit 128; guard rail 120) for the paths where latency, jitter and sequence errors matter: L2 intra-DC 22, L2 inter-DC 12, L3-BL 8, L3-DCFW 8, L3-ENTFW 8 and a DSCP group of 16 - BE (TOS 0x00) as the reference plus EF, AF41 and CS1, each on the same pairs, size and rate;
- 102 loss-only flow-stat streams (limit 1023; guard rail 600) at 100 pps for wide loss coverage, for example VLAN 1315 and the production VLANs.
Together that is about 176 streams and 20.6 kpps (10 400 pps latency, 10 200 pps loss-only).
See chapter 16 for how the streams are distributed over classes and APs.
Reading the results
The structure of get_pgid_stats
get_pgid_stats(pgid_list) returns two dictionaries (an empty list asks for all active pg_ids; the API reference
allows up to 1024 per call). get_stats() contains the same two entries next to the port counters.
{'flow_stats': {<pg_id>: {'tx_pkts':  {<port>: n, ..., 'total': n},
                          'rx_pkts':  {...}, 'tx_bytes': {...}, 'rx_bytes': {...},
                          'tx_pps':   {...}, 'rx_pps':   {...}, 'tx_bps':   {...}, 'rx_bps': {...},
                          'tx_bps_l1': {...}, 'rx_bps_l1': {...}},
                'global': {'rx_err': {<port>: n}, 'tx_err': {<port>: n}}},
 'latency':    {<pg_id>: {'err_cntrs': {'dropped': n, 'dup': n, 'out_of_order': n,
                                        'seq_too_high': n, 'seq_too_low': n},
                          'latency':   {'average': x, 'total_min': n, 'total_max': n, 'last_max': n,
                                        'jitter': n, 'histogram': {<bucket in usec>: count, ...}}},
                'global': {'old_flow': n, 'bad_hdr': n}}}
Structure as built by the v3.08 Python client (trex/stl/trex_stl_stats.py); values in microseconds.
Points that matter in practice:
- Every counter exists per port and as
'total'. A stream is transmitted on one port, but its packets may be received on several ports. Loss istx_pkts['total'] - rx_pkts['total']. - A latency stream also has a
flow_statsentry: its packet counters come for free. - In hardware mode
rx_bytesandrx_bpsare not available. tx_ppsandrx_ppsare smoothed by the server (each new value is averaged half-and-half with the previous one). For exact interval rates use counter differences.globalrx_errcounts flow-stat packets that could not be assigned to a pg_id - typically late arrivals after the stream was stopped;tx_err"is never expected". In the v3.08 Python client the latencyglobalcounters (old_flow,bad_hdr) are initialised to zero and, in the source as read, not filled from the server reply - do not build alerts on them before checking. confirm on the bench
The stateless guide shows a flow_stats object after a short run with three pg_ids
from TRex docs ("Tutorial: flow_stats object structure"):
{
 5: {'rx_pkts'  : {0: 0, 1: 0, 2: 500000, 3: 0, 'total': 500000},
     'tx_bytes' : {0: 0, 1: 39500000, 2: 0, 3: 0, 'total': 39500000},
     'tx_pkts'  : {0: 0, 1: 500000, 2: 0, 3: 0, 'total': 500000}},

 7: {'rx_pkts'  : {0: 0, 1: 0, 2: 0, 3: 288, 'total': 288},
     'tx_bytes' : {0: 17280, 1: 0, 2: 0, 3: 0, 'total': 17280},
     'tx_pkts'  : {0: 288, 1: 0, 2: 0, 3: 0, 'total': 288}},

 12: {'rx_pkts' : {0: 0, 1: 0, 2: 0, 3: 1439, 'total': 1439},
      'tx_bytes': {0: 849600, 1: 0, 2: 0, 3: 0, 'total': 849600},
      'tx_pkts' : {0: 1440, 1: 0, 2: 0, 3: 0, 'total': 1440}}
}
Read it like this: pg_id 5 was sent on port 1 and received on port 2, without loss; pg_id 12 was sent on port 0 and received on port 3 with one packet missing - or still in flight when the snapshot was taken (see below).
What each latency value means
The API reference defines the latency keys from TRex docs; the right-hand column adds
what the source code (src/time_histogram.cpp, src/utils/utl_jitter.h) shows:
| Key | Documented meaning | Details that matter |
|---|---|---|
average |
"Average latency over the stream lifetime (usec). Low pass filter is applied to the last window average: <average> = <prev average>/2 + <last sampling period average>/2" |
dominated by the last few seconds - not a lifetime mean |
total_min |
"Minimum latency measured over the stream lifetime (in usec)" | the best case of the path: closest to pure propagation and forwarding delay |
total_max |
"Maximum latency measured over the stream lifetime (in usec)" | TRex ignores the very first samples of a new stream for the maximum, to suppress start-up spikes |
last_max |
"Maximum latency measured between last two data reads from server (0.5 sec window)" | the server closes a sampling period every 0.5 s; covers only that window |
jitter |
"Jitter of latency samples, computed as described in RFC 3550 appendix A.8" | J = J + (abs(D) - J) / 16, where D is the difference between two consecutive latencies |
histogram |
"Keys ... represent range of latencies (in usec). Values are the total number of packets received in this latency range. For example, an entry {100:13} would mean that we saw 13 packets with latency in the range between 100 and 200 usec." | see below |
The histogram is logarithmic: below 10 µs everything lands in key 0; above, each decade has nine buckets - keys 10,
20 ... 90 (10 µs wide), 100 ... 900 (100 µs wide), 1000 ... 9000, 10000 ... 90000 and 100000 ... 900000 µs. The key is
the lower bound of the bucket. Counts are cumulative since the stream started: they only grow. Latencies of one
second or more fall outside the last bucket and only appear in total_max.
Latency values freeze when nothing arrives
The server closes a sampling period only if it received packets in it. When a path is completely down, last_max,
average and jitter keep their last values - a broken path can look perfectly healthy on a latency graph. A dead
path is visible in the counters: rx_pkts stops increasing and, once packets flow again, dropped jumps. Always
evaluate loss before latency.
The client keeps its own baseline
clear_stats() does not reset anything on the server. The Python client stores a snapshot and returns all later
counters, error counters and histogram counts relative to it; start() does the same automatically for the pg_id
statistics. Other clients - the console, the exporter, trexctl - are not affected, each has its own baseline. After a
clear, the client derives total_max itself from the last_max values it happens to read. The server resets its
counters for a pg_id only when the pg_id disappears (all its streams removed) and is created again, or when TRex
restarts; the reply carries a version number per pg_id (ver_id) so that clients notice.
Console views
| View | Shows | Limit |
|---|---|---|
stats -s, TUI key s |
Tx/Rx pps, Tx bps L2/L1, Rx bps, opackets/ipackets/obytes/ibytes per pg_id | at most 4 pg_ids, latency pg_ids first |
stats -l, TUI key l |
TX/RX pkts, Max/Min/Avg latency, "Last max" plus 13 earlier values, Jitter, Errors (seq_too_high + seq_too_low) |
at most 5 latency pg_ids |
stats --lh, TUI l then h |
histogram buckets plus dropped, dup, out_of_order, seq_too_high, seq_too_low |
at most 5 latency pg_ids |
The stateless guide shows the latency view from TRex docs (an older version, without the TX/RX and Min rows):
Latency Statistics (usec)

   PG ID     |       7       |       12
 ----------------------------------------------
 Max latency  |              0 |              0
 Avg latency  |              5 |              5
 -- Window -- |                |
 Last (max)   |              3 |              4
 Last-1       |              3 |              3
 Last-2       |              4 |              4
 ...
 Jitter       |              0 |              0
 ----         |                |
 Errors       |              0 |              0
In the LVR platform
trex-mon runs 74 latency streams; stats -l shows five of them and stats -s four pg_ids. The console is a tool
for spot checks; the complete picture comes from the exporter and Grafana (chapters 18 and 19). To look at one
specific stream from the command line, ask for it by pg_id with a short Python call, c.get_pgid_stats([17]), from
a client that is only connected - reading statistics needs no port ownership.
Computing loss correctly
In-flight packets and the end of a test
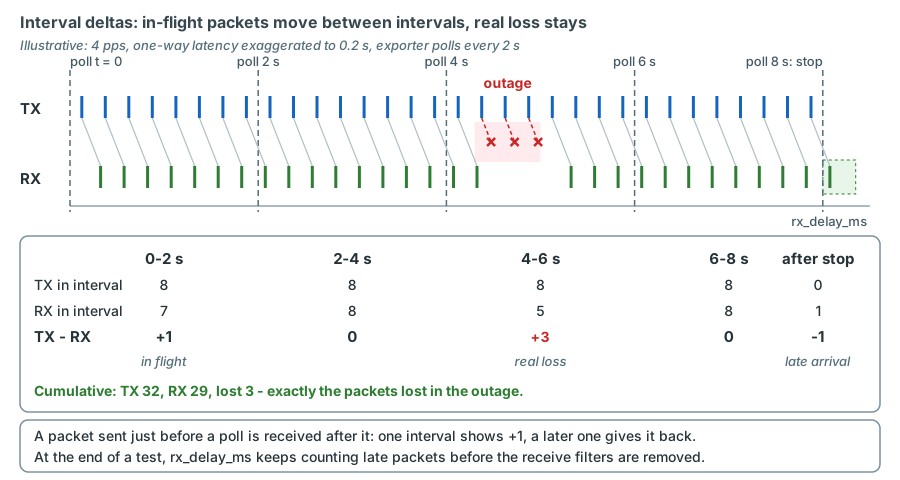
TRex counts a packet as transmitted when it is sent and as received when it arrives. At any moment the packets on the
wire and in device buffers are counted on one side only, so tx - rx taken while traffic runs is not loss:
- in flight ≈ rate × one-way latency: 200 pps × 100 µs = 0.02 packets (negligible); 8 Mpps × 100 µs = 800 packets (very visible in a line-rate test);
- transmit and receive counters are not read at exactly the same instant.
At the end of a test, stop() and wait_on_traffic() keep the receive filters active for rx_delay_ms after the
last packet was sent - by default 10 ms on physical ports and 100 ms on virtual ones. Packets that arrive later are
counted as errors (rx_err, old_flow) rather than as received. For paths with large buffers, such as a firewall
under load, pass a larger value: c.wait_on_traffic(ports=[0, 3], rx_delay_ms=200). Only after this delay is
tx_total - rx_total the final loss of the test.
Continuous monitoring: interval deltas
The monitoring streams never stop, so the exporter works with differences between two polls (every 2 s in the plan):
delta_tx  = tx_total(t) - tx_total(t - 2 s)
delta_rx  = rx_total(t) - rx_total(t - 2 s)
lost      = delta_tx - delta_rx
loss_rate = lost / delta_tx
outage    = lost / pps            (resolution 1/pps: 5 ms at 200 pps, 10 ms at 100 pps)
A packet sent just before a poll is often received just after it, so lost jitters by a packet or so between
intervals: +1 in one interval, -1 in the next. That is not loss and certainly not "gain". Sum interval values over a
longer window, or treat a single-packet difference as noise unless it repeats; the cumulative counters are always
exact. For latency streams compare with the sequence-based dropped counter, which has no timing ambiguity.
Counter resets
Counters restart from zero when a pg_id is removed and created again (a profile restart), when TRex restarts, and - in
the client's view only - after start() or clear_stats() in that client. An exporter must detect a counter that
went down (or a changed ver_id), take the new value as baseline and write nothing for that interval. Computing
new - old across a reset produces large negative loss or absurd rates.
Interval maxima: why last_max is not enough
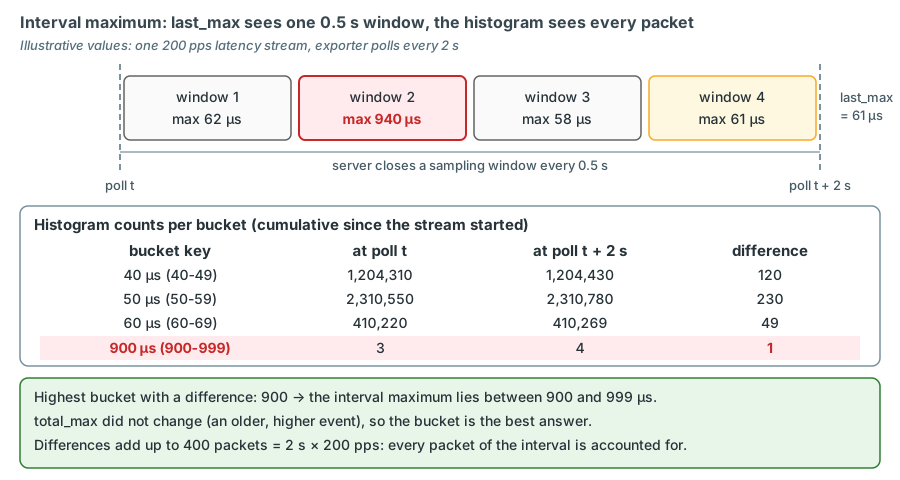
last_max covers only the last 0.5-second sampling period. An exporter that polls every 2 seconds reads one of four
periods: a 3 ms spike in any of the other three never reaches Grafana. Polling every 0.5 seconds would work, at four
times the load. The robust method uses the histogram, which counts every packet:
- At every poll, subtract the previous histogram from the current one, bucket by bucket.
- The highest bucket with a positive difference contains the interval maximum; its key is a lower bound and the next key an upper bound.
- If
total_maxincreased during the interval, the newtotal_maxis the exact interval maximum. - The same differences give an interval distribution - for example "how many packets above 1 ms".
def bucket_upper_us(key):
    """Upper edge of a TRex latency histogram bucket; the key is the lower edge in usec."""
    if key == 0:
        return 10                                            # key 0 = below 10 usec
    return key + 10 ** (len(str(key)) - 1)                   # 900 -> 1000, 40 -> 50, 2000 -> 3000


def interval_max_us(hist_now, hist_prev, total_max_now, total_max_prev):
    """Return (lower, upper) bounds of the maximum latency in the interval, in usec."""
    if total_max_now > total_max_prev:                       # new lifetime maximum: exact value
        return total_max_now, total_max_now
    for key in sorted(hist_now, reverse=True):               # highest bucket first
        if hist_now[key] - hist_prev.get(key, 0) > 0:
            return key, bucket_upper_us(key)                 # max lies in [key, upper)
    return None, None                                        # no packets in the interval
sketch - validate on the bench Use the counters of one client consistently: a
clear_stats() or start() in the exporter's own client shifts its baseline (see above). The LVR exporter convention
(chapter 18) stores the upper edge of the highest bucket that grew as the interval
maximum lat_max_us - a conservative value at bucket resolution - and writes no latency fields at all for an interval
in which no packet was received. TRex's own last_max is stored as well, as lat_last_max_us, but only for
reference: it is never used as the interval maximum.
Accuracy and offsets
Where the timestamps are taken. The transmit timestamp is read by the data-plane core just before the packet is handed to the NIC; the receive time is read when software processes the packet. A measured latency therefore includes the TRex transmit path, the wire and every device on the path, and the TRex receive path including polling. The stateless guide characterises TRex latency as "microsecond resolution (software-based)", compared with nanosecond resolution for hardware-based testers. With histogram buckets of 10 µs at the low end, read fabric latencies as "tens of microseconds", not to the single microsecond.
Receive model. How promptly software reads a packet depends on the receive model TRex selects at start
(chapter 3). With c: 1 in software mode (ONE_QUE, used by trex-mon) the RX core
polls the receive queues continuously. With c of 2 or more (MULTI_QUE) the DP cores read the queues only every
20 µs while they transmit, and the trex-core source warns that "latency won't be accurate in this mode". Check the
start-up log line "set dpdk queues mode to ONE_QUE" after every start of trex-mon
confirm on the bench.
Baselines. Measure what TRex itself adds before interpreting absolute values: a stream between two TRex ports connected back-to-back (DAC), and a stream that only crosses the TX switch, give the floor that every LVR measurement contains.
Fixed offsets in LVR paths. Every monitoring stream crosses its TX switch at least twice. Streams that start or end in RZC also cross the TX-to-TX fibre: once for RZK-RZC streams, twice for RZC-RZC streams, at about 5 µs per km, plus the hops through sw-rzc-TX1. An intra-RZC stream therefore always looks slower than the same stream type in RZK; the difference is calibration, not a fabric problem (chapter 14 and chapter 16).
Frame size. Each store-and-forward hop must receive the whole frame before forwarding it: about 0.1 µs for the 132-byte monitoring frame at 10 Gbit/s, 1.2 µs for a 1518-byte frame. Compare only latencies of the same frame size.
Receive load. In software mode a busy receive path delays processing and inflates latency - in trex-mon a single
RX core reads every received packet. A lab test that floods unknown unicast into the trex-mon ports can do exactly that
(chapter 24).
TRex also offers hardware-assisted latency with IEEE 1588 timestamps on some NICs; it needs a special build, a fixed packet format and UDP port 319, and is not used at LVR.
Pitfalls
| Pitfall | What you see | Explanation and remedy |
|---|---|---|
| pg_id reused for another path | a graph jumps to a new level and keeps it | Grafana history is per pg_id; keep the pg_id allocation stable |
| Two flow-stat streams with the same pg_id | counters of both added up | intended only for aggregates; LVR uses one pg_id per stream |
| Profile or TRex restart | negative loss, huge rates in one interval | counters restarted; exporter must detect the reset |
| Foreign packets with an IPv4 ID in 0xFC00-0xFFFF | a loss-only stream shows more received than sent | flooded production IPv4 packets whose ID happens to be in the reserved range are counted for that hw_id (about 1.6 % of random IDs). Latency streams are immune: they need the signature. Reduce flooding towards TRex |
| Duplicates caused by flooding | rx_pkts > tx_pkts, dup increases |
the TX switch flooded a return frame to two TRex trunk ports because the destination client MAC was not learned (for example aged out); keep client MACs learned (EMU, bidirectional streams, static MACs - chapters 6 and 24) |
| Asymmetric paths | A-to-B and B-to-A differ | expected: each direction has its own pg_id; routed RZC traffic crosses the DCI to the gateway in RZK, firewall direction depends on the active member |
last_max used as interval maximum |
peaks missing in Grafana | use histogram deltas or poll every 0.5 s |
| Latency graph flat during an outage | latency looks normal while the path is down | values freeze without packets; check rx_pkts and dropped |
rx_delay_ms too short at the end of a test |
small loss plus rx_err/old_flow |
late packets counted as errors; increase rx_delay_ms |
| Capture shows TOS 0xB9 for an EF stream | "remarking" suspected | TRex sets the lowest TOS bit itself; the DSCP is unchanged |
Key takeaways
- Port counters include everything on the port; per-path loss needs flow statistics with a pg_id per stream.
- Flow-stat packets are marked by a reserved IPv4 ID (0xFC00-0xFFFF in v3.08); latency packets carry IPv4 ID 0xFFFF and a 16-byte signature (magic, flow_seq, hw_id, sequence number, timestamp) at the end of the payload.
- X710 hardware mode counts in the NIC: line rate, 127 counters, no receive bytes, at most one VLAN tag. Software mode counts in the CPU: 1023 counters, QinQ, EMU - at a much lower receive rate.
- At most 128 latency streams per instance in any mode, with unique pg_ids, one port each, at least 16 bytes of payload, UDP checksum 0, no multiplier. Hence trex-mon combines 74 latency streams (including a DSCP group with a BE reference) with 102 loss-only streams - about 176 streams in total.
averageis low-pass filtered,last_maxcovers 0.5 s only, the histogram counts every packet cumulatively, jitter follows RFC 3550 A.8, and latency values freeze when no packets arrive.- Loss =
tx_total - rx_totalafterrx_delay_ms; in monitoring use interval deltas, tolerate in-flight noise and handle counter resets; for latency streamsdroppedis the sequence-based loss. - Interval maxima come from histogram deltas (or 0.5 s polling), never from
last_maxread every 2 s. - Latency is accurate to microseconds in the one-queue receive model of trex-mon (
c: 1) and includes the TX switch hops, the TX fibre for RZC streams and the TRex baseline.
Check your understanding
1. Why can trex-mon not use port counters to measure the loss of the path K-L11 to C-L21?
Port counters add up everything on a port: about 176 streams, EMU traffic and flooded production frames. The return
traffic of a stream may arrive on any TRex trunk port, depending on MAC learning on the TX switch. A difference of
port counters therefore mixes all paths. Flow statistics count per pg_id and give tx_pkts and rx_pkts of exactly
one stream.
2. A capture on sw-rzk-TX1 shows a monitoring packet with IPv4 ID 0xFC05 and another with 0xFFFF. What can you say about them?
0xFC05 is in the reserved range and is not 0xFFFF, so it belongs to a loss-only flow-stat stream with internal counter index 5 - the pg_id itself is not visible in the packet, TRex maps it internally. 0xFFFF marks a latency stream; its last 16 payload bytes contain magic 0xAB, the latency counter index, a sequence number and the transmit timestamp.
3. Give three independent reasons why trex-mon must run with --software.
The multiplexed monitoring ports carry double-tagged (QinQ) frames, which flow statistics support only in software mode; software mode gives 1023 flow-stat counters instead of 127 on the X710; and EMU, which answers ARP and ICMP for the TRex clients, refuses to run without software mode.
4. Why does the monitoring profile not simply use 176 latency streams?
A TRex instance supports at most 128 concurrent latency streams, regardless of hardware or software mode, because each needs its own receive state (sequence tracking, histogram, jitter). The 1023 counters of software mode apply to flow statistics only. The design therefore uses 74 latency streams where latency matters and 102 loss-only streams for coverage.
5. An exporter polls every 2 s and writes last_max as the interval maximum. What goes wrong, and what is the fix?
last_max is the maximum of the last 0.5 s sampling period only, so three out of four periods are never seen and
short spikes disappear. The fix is to subtract consecutive histograms and take the highest bucket with new packets
(or the new total_max if it increased), or to poll every 0.5 s.
6. During a 4-second outage on a 200 pps latency stream, Grafana shows a flat latency of 45 µs. Is the latency measurement broken?
No. Without arriving packets the server does not close sampling periods, so last_max, average and jitter
keep their last values. The outage shows in the counters: rx_pkts stops growing, and when the path recovers
dropped increases by about 800 packets (4 s × 200 pps). Always evaluate loss first.
7. A loss-only stream shows rx_pkts = 100,004 and tx_pkts = 100,000 after a test. Give two possible explanations.
The TX switch may have flooded some return frames to two TRex ports because the destination client MAC was not
learned, so they were counted twice; or foreign IPv4 packets with an ID in the reserved range were counted for the
same counter index. Both are artefacts of the measurement, not network behaviour. A latency stream would show the
first case as dup and be immune to the second.
8. Why is a latency of 120 µs for an RZC-to-RZC L2 stream not necessarily worse than 60 µs for the same stream type inside RZK?
Every frame enters and leaves through the TRex server in RZK. An RZC-to-RZC stream crosses the TX-to-TX fibre twice and the RZC TX switch twice more; at about 5 µs per km of fibre this can explain the difference. Compare like with like, or subtract the calibrated offset.
References
- TRex stateless guide, https://trex-tgn.cisco.com/trex/doc/trex_stateless.html: "Tutorial: Per stream statistics"
(implementation, limitations, Table 14,
--no-hw-flow-stat, TUI streams view); "Tutorial: flow_stats object structure"; "Tutorial: Per stream latency/jitter/packet errors" (signature, limitations, multiplier, 5 MPPS guidance, TUI latency view, error counter scenarios); "Tutorial: Latency using hardware assist"; "TRex vs IXExplorer" (latency resolution); "Tutorial: Python automation" (port-counter loss example). - TRex Stateless Python API, Client Module, https://trex-tgn.cisco.com/trex/doc/cp_stl_docs/api/client_code.html:
get_pgid_stats(all key tables quoted above),stopandwait_on_traffic(rx_delay_ms),clear_stats,get_active_pgids. - TRex manual, https://trex-tgn.cisco.com/trex/doc/trex_manual.html, command line options
--softwareand--no-hw-flow-stat. - trex-core source (master = v3.08, https://github.com/cisco-system-traffic-generator/trex-core):
src/trex_defs.h(MAX_FLOW_STATS 1023,MAX_FLOW_STATS_X710 127,MAX_FLOW_STATS_PAYLOAD 128);src/stx/stl/trex_stl_fs.hand.cpp(IP_ID_RESERVE_BASE,flow_stat_payload_header,FLOW_STAT_PAYLOAD_IP_ID, IP ID and TOS rewrite, error messages, counter lifecycle andver_id, rate smoothing);src/flow_stat_parser.cpp(set_ip_id,set_tos_to_cpu, incremental IPv4 checksum update);src/trex_modes.handsrc/trex_modes.cpp(receive modelsONE_QUE,MULTI_QUE,DROP_QUE_FILTER, "latency won't be accurate in this mode");src/main_dpdk.cpp(update_node_flow_stat: signature and timestamp on transmit; 500 ms slow path; EMU requires software mode);src/drivers/trex_driver_i40e.cpp(X710 flow-director rules, 127 counters, no byte counters in hardware mode);src/stx/common/trex_latency_counters.cpp(receive processing, sequence checks,old_flow,bad_hdr);src/time_histogram.cpp(histogram buckets, low-pass average, 0.5 s window, start-up maximum suppression);src/utils/utl_jitter.h(RFC 3550 jitter);scripts/automation/trex_control_plane/interactive/trex/stl/ trex_stl_stats.py(result structure, client-side baseline, console tables and their pg_id limits);.../trex/stl/trex_stl_client.py(rx_delay_msdefaults,start()clears the client baseline). - RFC 3550, appendix A.8 "Estimating the Interarrival Jitter", https://datatracker.ietf.org/doc/html/rfc3550#appendix-A.8.
- LVR monitoring design and budgets: chapter 16; traffic classes and fibre offsets: chapter 14; flooding risks: chapter 24.