11. Platform architecture
In this chapter
You will learn
- how each customer requirement maps onto a concrete design element and a traffic class
- what every component does: the TRex server, the two TRex instances, the TX switches, the attachment points, the
TX-to-TX fibre, the planned orchestrator
trexctl, InfluxDB and Grafana - why there are two TRex instances, and how the eight TRex ports p0-p7 are allocated and numbered inside each instance
- the design principles behind the platform and the reason for each of them
- which failures only cost measurement data, and the one design option where a test-path failure can reach production
- what was adopted from the MAN reference design and what was changed
Prerequisites: Chapter 2, Chapter 3, Chapter 6 and Chapter 10.
Chapter 10 described the network that is measured. This chapter describes the measuring instrument: which boxes and processes exist, how they are connected, and - more important for a support engineer - why they are arranged this way. Almost every later operational rule ("never configure a production VLAN on a TX switch", "lab tests only on p4-p7", "update the inventory when you re-pin a port") follows from one of the principles explained here.
From requirements to design
LVR-InfoKom stated six requirements (plan document, section 2.1). The table shows how each one is met in the fabric described in Chapter 10.
| Customer requirement | Design element | Traffic class / chapter |
|---|---|---|
| TRex server with several NICs | One server trex-rzk-01 in RZK with 2 x Intel X710-DA4 (8 x 10G SFP+) |
Ch. 17 |
| Traffic inside several production VLANs: permanent delay measurement and occasional performance tests | Two TRex instances: trex-mon (permanent, low rate) and trex-lab (on demand, line rate or stateful) |
Ch. 16, Ch. 22 |
| Layer 2 inside one VLAN | Streams between two APs in the same VLAN (intra- and inter-DC) | L2, Ch. 14 |
| Layer 3 within one VRF | VLAN 1314 to VLAN 1315, routed by sw-rzk-BL in VPN-CORE |
L3-BL |
| Layer 3 between VRFs and through the firewall | VPN-CORE through the Enterprise firewall into a dedicated TRex zone; production VLAN A to B through the DC firewall | L3-ENTFW, L3-DCFW, Ch. 15 |
| Server connected to one of two dedicated switches (one per DC) with links to every Leaf, Border Leaf and firewall | TX switches sw-rzk-TX1 and sw-rzc-TX1 (spare HPE 5950), one 10G attachment point per Leaf/BL IRF pair, joined by a dedicated TX-to-TX fibre. The firewall is reached through the Border Leaf APs (firewall-zone option B, the plan's default); a direct firewall port per member is option A decision |
Ch. 12, Ch. 13, Ch. 15 |
| Grafana visualisation | InfluxDB OSS 2.x and Grafana on the TRex server | Ch. 8, Ch. 19 |
| MAN Truck & Bus TRex documentation v1.3 as inspiration | Concepts adopted where they fit a production fabric | below |
Two interpretations are worth knowing. First, "Layer 3 in the default routing table" has no end-system meaning at LVR: the public instance of the switches carries only the underlay (loopbacks, OSPF 172, BGP EVPN), so all end-system routing happens in VPN instances. Second, "through the firewall" has two concrete forms: the DC firewall routes between production server VLANs, the Enterprise firewall routes between VRFs.
Decisions already taken with LVR (12 October 2026) fix the frame of the design: spare HPE 5950s as TX switches, a
dedicated dark fibre or DWDM channel between them, one TRex server in RZK with 10G X710 NICs, one 10G link per Leaf/BL
IRF pair, Check Point firewalls, 16 reserved addresses per monitored VLAN, VPN-CORE first (VPN-WAN/VPN-WLAN later),
InfluxDB and Grafana on the server, the custom orchestrator trexctl, stateful (ASTF) tests in scope, RHEL 9 or a
compatible distribution, DSCP per-class measurements in scope; IPv6, multicast and RZD out of scope. One decision of that
meeting is open again: the direct link from the TX switches to the firewall. It would make the test path part of a
monitored firewall-cluster interface, so the plan now recommends the existing transfer VSI 4003 instead (firewall-zone
option B) and asks LVR to decide again (below, Chapter 15).
The components
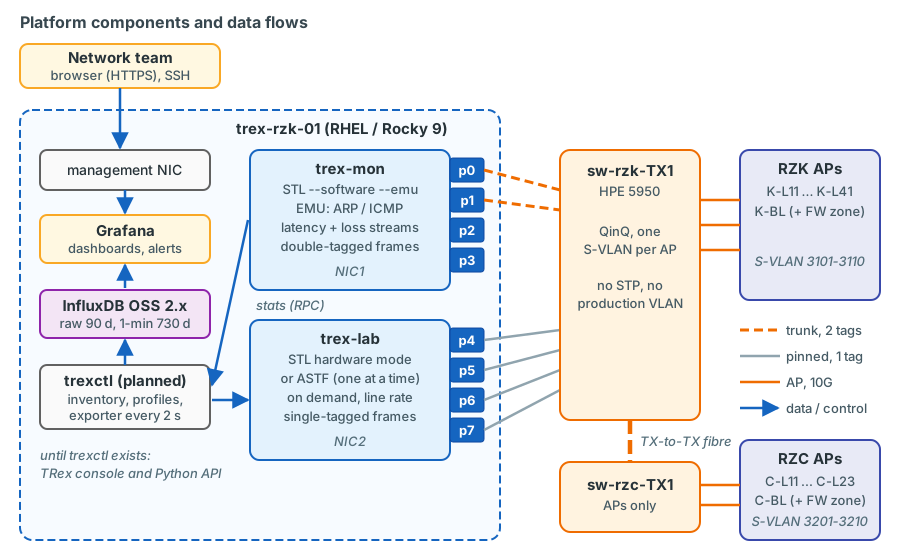
The TRex server trex-rzk-01
| Item | Choice | Why |
|---|---|---|
| Chassis | HPE ProLiant DL380 Gen11 (or DL360) | HPE support, iLO, PCIe slots for both NICs on one CPU |
| CPU | 1 socket, 16 cores | Enough threads for two TRex instances plus InfluxDB/Grafana; a single socket avoids NUMA pitfalls (Ch. 3) |
| Memory | 128 GB | Hugepages for two TRex instances and room for InfluxDB |
| Data NICs | 2 x Intel X710-DA4 (8 x 10G SFP+) | X710 is TRex's preferred 10G NIC with hardware flow statistics |
| Management | Separate NIC under Linux control | SSH, Grafana (HTTPS), NTP; the DPDK data ports have no IP stack |
| Software | RHEL 9 / Rocky 9, TRex v3.08, InfluxDB OSS 2.9.x, Grafana 12.4.x or 13.x | Supported OS; current TRex and data stack |
The server stands in RZK, in the rack of sw-rzk-TX1, and is cabled to it with passive DAC cables (the X710 accepts only
Intel-coded optics; DAC usually works, test one cable first).
Two TRex instances on one server
trex-mon |
trex-lab |
|
|---|---|---|
| Purpose | Permanent monitoring | On-demand tests |
| NIC / ports | NIC1, p0-p3 = instance ports 0-3 (p0 RZK APs incl. the firewall-zone client at K-BL, p1 RZC APs incl. the one at C-BL, p2/p3 reserve) | NIC2, p4-p7 = instance ports 0-3 |
| TRex mode | Stateless, --software --emu |
Stateless hardware mode (line rate, X710 hardware flow statistics) or ASTF - separate systemd units, only one at a time |
Data-plane threads per port pair (c) |
c: 1 - one-queue receive mode (ONE_QUE), needed for accurate latency in software mode |
c: 4 - in hardware mode latency is accurate with any c |
| Frames towards the TX switch | Double-tagged (S-VLAN + production VLAN) | Single-tagged (production VLAN only) |
| Address resolution | EMU clients answer ARP and ICMP for the TRex addresses | Port service mode / ASTF topology, one VLAN per port and test |
| Statistics limits | 128 latency streams; up to 1023 flow-stat streams (software mode) | 128 latency streams; 127 hardware flow-stat streams on X710 |
| Control ports (planned) | RPC 4501, publisher 4500, EMU 4510 | RPC 4601, publisher 4600 |
Why two instances and not one?
- The monitoring must never stop for a test. A TRex instance runs one mode at a time - stateless or ASTF - and switching means restarting the process. Lab tests also reset ports, reload profiles and occasionally crash. With a separate instance none of that touches the permanent streams.
- The two jobs need different TRex modes. Monitoring needs
--software: only in software mode does TRex count flow statistics for QinQ frames, and it raises the flow-stat limit from 127 to 1023 (TRex stateless guide, "Per stream statistics - Limitations", Table 14). It also needs EMU for ARP. Line-rate tests need the opposite: hardware mode, where the X710 counts in hardware but supports at most one VLAN tag. - Isolation of resources. Each instance has its own NIC, CPU threads, memory limit, file prefix and ZMQ ports (TRex
manual, "Platform configuration"). A 10 Gbit/s lab test cannot starve the monitoring of CPU or queues. One thing is
shared: the helper services - the Scapy server (port 4507) and the EMU server (4510) - exist once per host. Every
interactive stateless start restarts the Scapy server unless TRex is started with
--no-scapy-server, and a second instance started with--emuwould restart the EMU server. The lab units therefore run with--no-scapy-serverand never with--emu(Chapter 17); check on the bench that starting and stopping a lab unit leavestrex-monuntouched confirm on the bench. - Isolation of risk. Everything that can harm production at high rate lives in
trex-lab, which is started only under change control.trex-monis low-rate by construction.
Why trex-mon runs with a single data-plane thread
In software mode the number of data-plane threads per port pair (c) also decides how TRex receives packets. With
c: 1 TRex uses the one-queue mode (ONE_QUE): the RX core reads the port's receive queue itself, and latency is
measured accurately. With c: 2 or more it switches to MULTI_QUE: the data-plane threads read the receive queues and
pass the latency packets on, and the TRex source warns that latency is then not accurate. The monitoring's roughly
20 kpps need far less than one core, so trex-mon uses c: 1; its startup log /var/log/trex/trex-mon.log must
contain "set dpdk queues mode to ONE_QUE" (Chapter 3,
Chapter 17). trex-lab runs in hardware mode, where the X710 steers latency packets to the RX
core with a hardware filter, so it can use four threads for line rate.
The TX switches
sw-rzk-TX1 (RZK) and sw-rzc-TX1 (RZC) are spare HPE FlexFabric 5950s running Comware 7 R630x. They are deliberately
dumb: no production VLAN, no VXLAN, no routing, no spanning tree. Each attachment point is an isolated QinQ bridge
domain: the outer tag (S-VLAN) selects the AP, the inner tag is the production VLAN, which the TX switch never interprets.
Adding a VLAN under test therefore never touches a TX switch. Chapter 12 explains the mechanism
and the complete configuration.
The attachment points
An attachment point (AP) is one 10G link from a TX switch into a Leaf or a Border Leaf. On the production side it is an ordinary server-style trunk port with one service instance per VLAN under test (Chapter 13). There are 13 APs:
| DC | APs | S-VLANs on the TX switch |
|---|---|---|
| RZK | K-L11, K-L12, K-L21, K-L31, K-L41, K-BL | 3101-3105, 3110 |
| RZC | C-L11, C-L12, C-L13, C-L21, C-L22, C-L23, C-BL | 3201-3206, 3210 |
| both, option A only | FW (a new firewall port per cluster member) | 3300 - defined on both TX switches, its firewall ports configured but shut down decision |
Each Leaf/BL IRF pair gets one link, on IRF member 1. The firewall test zone needs no AP of its own in the plan's
default, firewall-zone option B: the zone is the existing transfer VSI 4003, which already reaches both firewall members,
and TRex reaches it through the Border Leaf APs K-BL and C-BL, which carry VLAN 4003 next to 1314/1315. Only option A
would add a fourteenth AP, FW, with S-VLAN 3300; its TX-switch ports XGE1/1/7 (sw-rzk-TX1) and XGE1/1/8 (sw-rzc-TX1)
are already configured for it and shut down (Chapter 12, Chapter 15).
The TX-to-TX fibre
A dedicated dark fibre or DWDM channel joins sw-rzk-TX1 and sw-rzc-TX1. It carries only the RZC S-VLANs 3201-3210
and the firewall-zone S-VLAN 3300 of option A, which is permitted on the trunk but has no active member port with the
default option B. Its purpose is the second design principle below: the RZC attachment
points reach the TRex server in RZK without using the production DCI. Two properties matter for measurements:
- A fixed latency offset. Every frame starts and ends in RZK. An RZK-to-RZC stream crosses the TX fibre once (on the way back), an RZC-to-RZK stream once (on the way out), an RZC-to-RZC stream twice. At about 5 µs per km this is a constant that has to be known and calibrated (Chapter 14, Chapter 16).
- A shared bottleneck. If the fibre runs at 10G, monitoring and lab traffic of all seven RZC APs share it; a lab test near 10 Gbit/s towards RZC disturbs the RZC monitoring. 40G or 100G optics avoid that. The real distance decides which optics or DWDM channel are needed confirm with LVR.
trexctl - the planned orchestrator
trexctl does not exist yet. It is specified in the plan document (section 9) and must be developed. Its job will be
to turn a declarative description of the environment (inventory: APs, S-VLANs, ports, VLANs, address pools, gateways)
and of the wanted traffic (profiles: stream groups, rates, sizes, DSCP) into EMU clients and TRex streams, to start and
stop them, to run lab test procedures, and to export statistics to InfluxDB. Until it exists, everything is done with
native TRex: the TRex console and the Python STL/EMU APIs (Chapter 4,
Chapter 6, Chapter 18). Learning the native way first is not a detour:
when trexctl misbehaves, the native tools are what you debug it with.
InfluxDB and Grafana
InfluxDB OSS 2.x (2.9.x, pin the 2.x packages - InfluxDB 3 is a different product) and Grafana (12.4.x or 13.x) run on the
TRex server. An exporter polls TRex every two seconds (get_pgid_stats for the per-stream counters and latency, plus
port and global statistics), converts the values into InfluxDB line protocol and writes them into a raw bucket
(planned retention 90 days) from which a task builds a one-minute long-term bucket (730 days). Grafana shows dashboards
and evaluates alert rules (Chapter 8, Chapter 9,
Chapter 19).
Management access
People and tools reach the platform only through management interfaces: the server's management NIC (SSH, Grafana over
HTTPS) and the M-GigabitEthernet0/0/0 ports of the TX switches in the MGMT VRF, bound with ip binding vpn-instance
MGMT as on the Border Leafs. The TRex data ports are DPDK ports: they have no kernel IP stack, cannot be reached with SSH
or ping, and never route or bridge between each other. Only EMU answers ARP and ICMP - and only for the configured TRex
client addresses.
The TRex control ports need explicit protection
The TRex control ports - RPC 4501/4601, publisher 4500/4600, EMU 4510 and the Scapy server 4507 - listen on all
addresses of the server, including the management NIC, and have no authentication: anyone who reaches them can start
traffic into production. In addition, trex-cfg, which the t-rex-64 wrapper runs at every start, stops firewalld on
Red Hat-family systems, so a firewalld-based host firewall is off after every TRex start. How the server is protected
(for example an nftables allow-list for the management hosts plus ACLs in the management network) is an open
decision of the server build (Chapter 17).
Port allocation on the TRex server
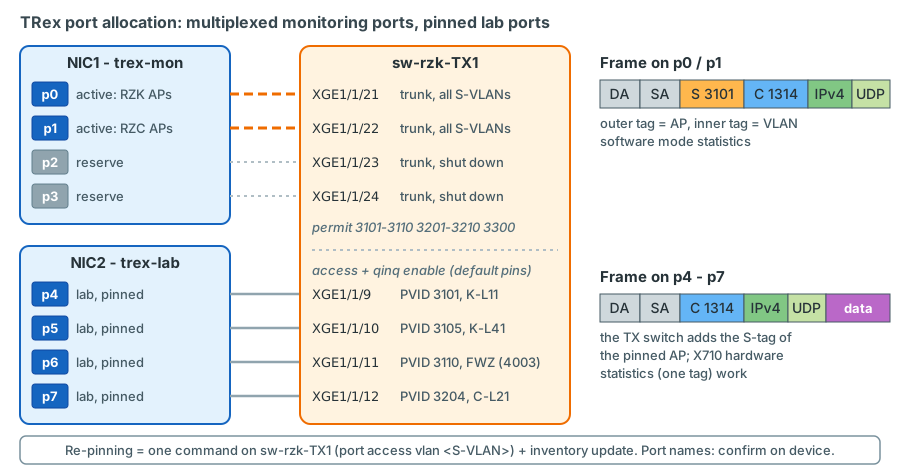
FWZ: K-BL with VLAN 4003, the firewall
zone.| TRex port | NIC | Instance | sw-rzk-TX1 port |
TX switch mode | Frames on the TRex link | Default use |
|---|---|---|---|---|---|---|
| p0 | NIC1 port 0 | trex-mon |
XGE1/1/21 | Trunk, all S-VLANs | double-tagged | RZK APs, incl. the firewall-zone client at K-BL |
| p1 | NIC1 port 1 | trex-mon |
XGE1/1/22 | Trunk, all S-VLANs | double-tagged | RZC APs, incl. the firewall-zone client at C-BL |
| p2, p3 | NIC1 ports 2-3 | trex-mon |
XGE1/1/23-24 | Trunk, shut down | - | Reserve (growth; a second monitoring instance would need bench validation) |
| p4 | NIC2 port 0 | trex-lab |
XGE1/1/9 | QinQ access, PVID 3101 | single-tagged | pinned to K-L11 |
| p5 | NIC2 port 1 | trex-lab |
XGE1/1/10 | QinQ access, PVID 3105 | single-tagged | pinned to K-L41 |
| p6 | NIC2 port 2 | trex-lab |
XGE1/1/11 | QinQ access, PVID 3110 | single-tagged | pinned to FWZ = K-BL with VLAN 4003, the firewall zone (option A: PVID 3300) decision |
| p7 | NIC2 port 3 | trex-lab |
XGE1/1/12 | QinQ access, PVID 3204 | single-tagged | pinned to C-L21 |
The port names assume a 24-port SFP+ module in slot 1 of the spare chassis confirm on
device. The split of APs between p0 and p1 and the lab pins are the planned inventory defaults (plan document,
section 9.3). FWZ is an inventory alias, not an AP: it names K-BL together with VLAN 4003 - p6 sends single-tagged
VLAN 4003 frames into the firewall zone, and the TX switch pushes K-BL's S-VLAN 3110 onto them. Every lab port has a fixed
MAC (02:54:52:f0:00:04 for p4 ... :07 for p7, set as src_mac in the TRex configuration) whatever it is pinned to;
only its IP follows the pinned AP (see "One client, one port" below).
The labels p0-p7 name the server's eight ports. Inside each TRex instance the ports are numbered from 0 in the order of
its interfaces list: on the trex-mon console p0-p3 are ports 0-3, on the trex-lab console p4-p7 are ports 0-3
(p4 = port 0, p7 = port 3), and the ASTF unit trex-lab-astf uses its own list [p4, p6], so that port 0 = p4 is the
client side and port 1 = p6 the server side. Console and API commands always take these instance-local numbers
(Chapter 17).
Why the monitoring ports are multiplexed
Thirteen APs, eight ports, and a monitoring rate of a few hundred packets per second per stream: dedicating one 10G port per AP would waste ports and still not be enough. With QinQ, one trunk port reaches every AP - the outer tag selects the AP, the inner tag the VLAN - so any stream can be sent from any monitoring port without re-cabling or reconfiguring the TX switch. The cost is that TRex must run in software mode, which the monitoring needs anyway.
Why the lab ports are pinned
A line-rate test needs a full 10G port per AP, and hardware-assisted statistics on the X710 support at most one VLAN
tag. A pinned lab port is itself a QinQ access port on the TX switch: TRex sends an ordinary single-tagged frame, the
switch adds the S-tag of the AP it is pinned to. Re-pinning is one command (port access vlan <S-VLAN>) on the TX
switch plus an inventory update (Chapter 12).
One client, one port
Inside one S-VLAN, every TRex client MAC must be sourced from exactly one TX-switch port. If the same client sent from
p0 and p1, the TX switch would see the MAC move between XGE1/1/21 and XGE1/1/22 and deliver the return traffic to
whichever port it saw last. That is why each AP is served by one monitoring port, and why lab clients use their own
identity: a fixed MAC per lab port (02:54:52:f0:00:04 for p4 ... 02:54:52:f0:00:07 for p7, which never collides
with a monitoring MAC 02:54:52:<AP index>:...) and the lab IP range .151-.166 (lab IP = .151 + AP index - 1 of the
pinned AP) - they share S-VLANs with the monitoring clients. The MAC cannot follow the AP: TRex answers ARP for a lab
port with the port MAC, and a lab port is re-pinned over time.
Design principles
The platform follows seven principles. Each one answers a concrete risk of measuring inside a production network.
1. Never bridge production VLANs between attachment points. Production VLANs such as 1314 are stretched by VXLAN across all Leafs, and STP is disabled for most of them (Chapter 10). If the TX switch connected two APs in one bridge domain, a frame could leave the fabric at Leaf A, cross the TX switch and re-enter at Leaf B: a Layer 2 loop through the fabric that nothing would block. Every S-VLAN therefore contains exactly one AP port plus TRex ports, and TRex never forwards between its ports. The plan's default, firewall-zone option B, keeps this rule without exception: the zone is VLAN 4003, an inner tag at the K-BL and C-BL APs like any other VLAN. Only option A would add a deliberate exception - S-VLAN 3300, already defined on both TX switches, joining the zone ports of the two members of one firewall cluster once those ports are enabled. It would be safe because the zone VLAN of option A exists only on the firewall interfaces, never in the fabric.
2. The return path is independent of the network under test. The RZC APs reach the server over the dedicated TX-to-TX fibre, never over the production DCI. A DCI failure therefore shows up as loss on the inter-DC streams - exactly what it should show - while the intra-RZC streams keep reporting. If the measurement path used the DCI itself, a DCI outage would blind the monitoring of an entire data centre at the moment it is needed most.
3. Low footprint. The default monitoring profile is about 176 streams (74 latency streams and 102 loss-only flow-stat streams), about 20.6 kpps, about 22 Mbit/s at Layer 2 and about 26 Mbit/s on the wire, with 128-byte frames (256 bytes in the DSCP group), at most 100 pps per stream through a firewall and hard guard rails (at most 120 latency streams, 600 flow-stat streams, 50 kpps in total; Chapter 16). On the production devices only the AP ports are configured; 16 addresses per monitored VLAN are reserved in IPAM (plus the lab-client range .151-.166 in every VLAN used for lab tests). The monitoring must be invisible next to production traffic, and it must never be the reason a firewall session table or a CPU looks unusual.
4. Separate monitoring and lab. Separate instances, NICs, TX-switch ports, systemd units, client MAC/IP ranges and pg_id ranges. A test must never interrupt or falsify the permanent measurements, and it must be obvious from any packet or counter which of the two produced it.
5. The inventory is the single source of truth. One description holds every AP (device, port, TX port, S-VLAN, AP
index), every TRex port role, every VLAN under test with its gateway and address pool. Client addresses are derived from
it deterministically - IP = pool start + (AP index - 1), MAC = 02:54:52:<AP index>:<VLAN high>:<VLAN low>, for example
K-L11 in VLAN 1314 is 10.3.14.101 / 02:54:52:01:05:22; a lab port keeps its fixed MAC and takes only its IP from the
pinned AP. Stream definitions, EMU clients, Grafana labels and the Leaf
configuration snippets are all generated from it. When a fact changes (a re-pinned lab port, a new VLAN), the inventory
changes first.
6. Reproducible configuration. The TX switches are built from a template (Chapter 12), the Leaf AP ports from a template (Chapter 13), the TRex instances from version-controlled configuration files and systemd units (Chapter 17). Configuration snapshots are taken before and after every change. A replacement TX switch or server can be rebuilt in hours, and every state can be explained.
7. Native TRex first. trexctl is a convenience layer, not a dependency. Everything it will do can be done with the
TRex console and the Python API, and on day one that is the only way.
Failure modes and their impact
A good measurement platform fails safe: when a part of it breaks, you lose data, not production. In the plan's default design this holds for every hardware failure of the platform. The exceptions are mistakes - a misconfigured TX switch or lab test - and, only if firewall-zone option A were chosen, the firewall zone.
| Failure | Effect on measurements | Effect on production | How you notice |
|---|---|---|---|
TRex server down, or trex-mon crashed |
All monitoring stops | None | Grafana "no data" alert; systemd restarts the unit |
trex-lab crashed during a test |
Test aborted; monitoring continues | None (traffic stops) | Test runner / console |
sw-rzk-TX1 down or rebooting |
All APs lost - the RZC S-VLANs also pass through it | None with the default firewall-zone option B (option A: see below) | All streams drop at once |
sw-rzc-TX1 down |
The seven RZC APs lost | None (option A: see below) | All RZC streams drop |
| TX-to-TX fibre cut | RZC APs lost; inter-DC and RZC streams drop | None (option A: see below) | RZC streams drop, RZK-only streams fine |
| One AP link, optic or port down | Streams of that AP fail | None (only TRex sits behind the AP) | Streams of one AP drop |
| IRF member 1 of a Leaf reboots | That AP is down for the duration | The reboot itself, not the AP | "Path down" for one AP - by design |
| TX switch misconfigured (two APs in one S-VLAN, STP enabled, production VLAN configured) | Unpredictable | Possible loop through the fabric | Storm, MAC moves - see Ch. 12 |
| Lab test misconfigured (unknown destination, wrong rate) | Monitoring disturbed | Possible flooding at up to 10 Gbit/s | Ch. 24 |
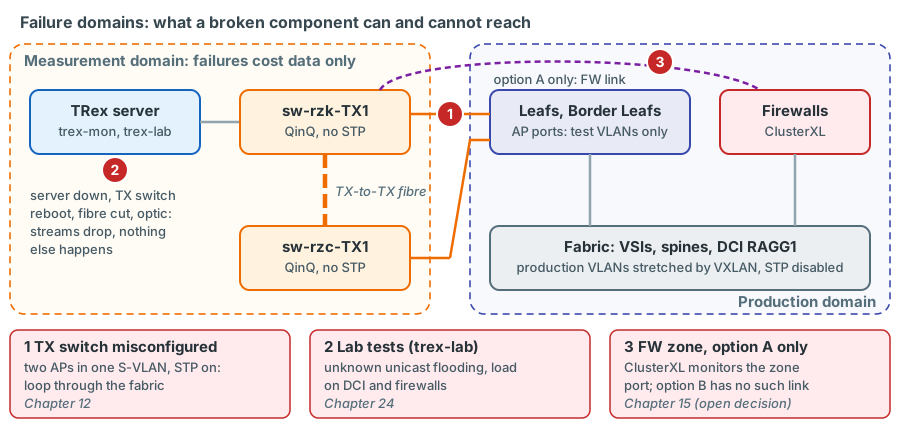
The firewall zone: no exception with option B
With firewall-zone option B, the plan's default, the zone is a VLAN 4003 interface on the existing inside bond of both members (BAGG10 to the Border Leafs). Nothing the cluster monitors depends on the TX switches, the TX fibre or a TRex port: when one of them fails, the zone streams stop like all others, and the firewall does not notice. Option B adds no exception to the table above.
Option A would. Each Enterprise-firewall member would get a new physical 10G interface connected to its local TX switch (S-VLAN 3300, stretched over the TX-to-TX fibre; the TX-switch ports XGE1/1/7 and XGE1/1/8 are already configured for it and shut down), and the zone VLAN with its cluster VIP would live on that interface. Check Point ClusterXL monitors cluster interfaces. A failure in the non-redundant test path - a TX-switch reboot, a cut TX fibre, a failed optic, even a TRex port - could therefore put a cluster member into a problem state and trigger a production failover or a loss of redundancy. With option A the statement "a TX-switch failure never affects production" holds only once the firewall team has made the interface non-critical for failover or formally accepted the risk.
Open decision: how the firewall test zone is connected
Option B - the existing free transfer VSI 4003 (recommended by the plan, used as the default). "Transfer ENTFW *frei*" is already trunked to both members on BAGG10 over LACP. The firewall team adds a VLAN 4003 interface (VIP 10.9.90.1) on the existing bond, and TRex reaches the zone through the Border Leaf APs K-BL and C-BL like any other VLAN. No new firewall ports or optics, existing redundancy, no dependency of the cluster on the TX switches or the TX fibre. The zone leg also crosses the fabric, and it is not a physical link from the TX switch.
Option A - a dedicated physical interface per member, via the TX switches. The customer's original wish for a physical firewall link from the TX switch; the zone leg bypasses the fabric. Needs a free 10G port and certified optics on each member, and the firewall team must confirm a supported way, for the Check Point version in use, to make the interface non-critical for failover - or accept the risk formally.
The plan recommends option B and uses it as the default; option A remains the alternative decision. The trade-offs, routing and rules are covered in Chapter 15; Appendix D tracks the decision.
Comparison with the MAN reference design
The MAN Truck & Bus TRex documentation v1.3 (German) describes a TRex installation in a data-centre test laboratory. It was the customer's reference. LVR measures a production fabric, which explains most of the differences.
| Element | MAN reference design | LVR platform | Why |
|---|---|---|---|
| Environment | Test laboratory replicating the DC; convergence and throughput tests | Production fabric; permanent monitoring plus occasional tests | Production needs isolation, low footprint and change control |
| TRex switch | One Cisco C9500-48Y4C as "switching point and multiplexer", dot1q tunnel per AP | Two HPE 5950 (one per DC) with Comware qinq enable, one S-VLAN per AP, plus a dedicated TX-to-TX fibre |
Two DCs; Comware platform decided; return path independent of the DCI |
| TRex ports | 12 (three quad-port X710); in the DC set-up one AP per TRex port | 8: two multiplexed monitoring ports for 13 APs, four pinned lab ports | More APs than ports; monitoring is low rate |
| Multiplexing | Double-tagged multiplexing described as "the most complex, but most scalable" option; a single-tagged variant avoids MAC flapping on the TRex switch | Double tags on the monitoring ports; each client MAC on one port per S-VLAN; isolated S-VLANs | Same concerns, solved by the S-VLAN and inventory design |
| TRex mode | --software --emu (EMU for ARP) |
trex-mon --software --emu; trex-lab hardware mode or ASTF |
QinQ statistics need software mode; line rate needs hardware mode |
| Orchestration | Proprietary trex_client.py with setup and profile YAML files |
trexctl (planned) with inventory and profile files |
Concept adopted; the code is not available to LVR |
| Statistics pipeline | InfluxDB 1.8, Grafana 7, one-second sampling | InfluxDB OSS 2.x, Grafana 12.4.x or 13.x, two-second sampling, downsampled long-term bucket | Current versions; retention planning |
| Stream rate | 1000 pps per stream (1 ms loss resolution) | Latency streams 200 pps in the fabric and 50 pps through firewalls, loss-only streams 100 pps; raised temporarily for convergence tests | Footprint and firewall load in production |
| Stream limits | About 1024 stream groups | 128 latency streams per instance plus up to 1023 flow-stat streams (software mode) | Verified TRex limits (Ch. 5, Ch. 16) |
| Service management | trex_daemon_server under systemd |
Static systemd units (trex-mon, trex-lab, trex-lab-astf), the two lab units mutually exclusive |
Simpler and deterministic |
Key takeaways
- One TRex server in RZK with two X710-DA4 NICs reaches all 13 attachment points in both DCs through two TX switches and a dedicated TX-to-TX fibre; the firewall test zone (VLAN 4003, option B) is reached through the Border Leaf APs.
trex-mon(NIC1, software mode withc: 1for accurate latency, EMU, double-tagged frames) runs the permanent monitoring;trex-lab(NIC2, hardware mode or ASTF, single-tagged frames) runs the tests. They never share NICs, ports, addresses or CPU threads.- p0/p1 are multiplexed trunks for all APs, p2/p3 are reserve, p4-p7 are lab ports pinned to one AP each; re-pinning is one
command on
sw-rzk-TX1. - The TX switches know no production VLAN; every AP is an isolated S-VLAN. This is what prevents loops through the fabric.
- The RZC APs return to the server over the TX fibre, never over the production DCI, so the platform keeps measuring when the DCI fails - and the TX fibre adds a fixed, calibratable offset to RZC streams.
- With the plan's default firewall-zone option B, hardware failures of the platform cost only measurement data. Only option A, the open alternative, would let ClusterXL react to a test-path failure. Production can also be affected by TX-switch misconfiguration and by lab tests.
trexctldoes not exist yet; the native TRex console and API are the day-one tools.
Check your understanding
1. Why can trex-mon not simply run in hardware mode to save CPU?
In hardware mode the X710 counts flow statistics only for IPv4/IPv6 with at most one VLAN tag. The monitoring frames
carry two tags (S-VLAN and production VLAN), so their statistics are only available with --software, which also
raises the flow-stat limit to 1023 streams. EMU, which answers ARP for the TRex clients, is used in the same instance.
2. A colleague wants to run a 9 Gbit/s throughput test from p0 because p4 is busy. What do you answer?
No. p0 belongs to trex-mon; a line-rate test there would disturb or falsify the permanent monitoring, and trex-mon
runs in software mode, which is not meant for line rate. Use a free lab port (p4-p7) and re-pin it on sw-rzk-TX1 to
the wanted AP, under change control.
3. The TX-to-TX fibre is cut. What do you expect in Grafana, and what happens to production?
All streams to or from the RZC APs drop (they cannot reach the server in RZK), while RZK-only streams keep working. Production is not affected with the default firewall-zone option B: the zone lives on the firewall's existing bond. Only if option A were chosen would the zone interfaces of the two firewall members lose contact with each other over the cut fibre, and ClusterXL could react.
4. Why must a lab client never reuse the MAC address of a monitoring client of the same AP?
Both clients live in the same S-VLAN on the TX switch: the monitoring client behind a monitoring trunk port, the lab
client behind a pinned lab port. With the same MAC, the TX switch would learn the address alternately on both ports
and deliver the return traffic to the wrong one. The lab clients therefore have their own identity: a fixed MAC per
lab port (02:54:52:f0:00:04 for p4 ... :07 for p7), which can never equal a monitoring MAC
02:54:52:<AP index>:<VLAN>, and the lab IP range .151-.166.
5. Which design principle is violated if the RZC APs are reached through a VLAN on the production DCI, and what would the consequence be?
The principle "return path independent of the network under test". During a DCI outage the monitoring of all RZC paths would stop at the same moment as the fault occurs, so the platform could not tell an RZC-internal problem from the loss of its own measurement path.
6. Name the ways in which the platform can affect production, and the chapter where each is handled.
Two apply to every design: a misconfigured TX switch that bridges production VLANs between APs or takes part in spanning tree (Chapter 12), and lab tests that flood or overload production paths (Chapter 24). A third exists only if firewall-zone option A is chosen instead of the default option B: a test-path failure could then trigger ClusterXL (Chapter 15).
7. What did LVR adopt from the MAN design, and what is the most important difference?
Adopted: a dedicated TRex switch with one tunnel (S-VLAN) per attachment point, --software --emu for multi-VLAN ARP,
the split between an environment description and traffic profiles, InfluxDB and Grafana. The most important
difference is the environment: MAN measured a laboratory, LVR measures production - hence two instances, a low
footprint, strict isolation and a return path independent of the DCI.
References
- Plan document v0.92 "TRex measurement platform LVR-InfoKom" (14 October 2026): section 2 (requirements and decisions,
including the reopened direct-firewall-link decision in 2.3), section 3.3 (lessons from the reference design), section
4.1 (components), section 4.3.5 (firewall-zone options), section 4.6.1 (attachment points and S-VLANs), section 4.6.3
(client addressing, fixed lab-port MACs), section 4.7 (two
instances), section 4.8 (failure modes), section 9 (
trexctlspecification, inventory 9.3). - MAN Truck & Bus, "TRex Dokumentation" v1.3 (German), chapters "Architektur" (Gesamtbild, Topologie, Einsatzszenarien - mehrere Anschlusspunkte pro TRex-Port) and "Datacenter Test-Setup".
- TRex stateless guide, https://trex-tgn.cisco.com/trex/doc/trex_stateless.html, section "Tutorial: Per stream statistics" - Limitations and Table 14 "Maximum concurrent streams for collecting flow statistics"; section "Tutorial: Per stream latency/jitter/packet errors" - Limitations.
- TRex manual, https://trex-tgn.cisco.com/trex/doc/trex_manual.html, section "Platform configuration" (prefix, ZMQ ports, memory limits for several instances).
- Chapter 10 for the fabric facts (diagnostic files of 17/18 February 2025).