20. Running the platform day to day
In this chapter
You will learn
- who does what on the platform (network operator, platform administrator, firewall administrator) and why the TRex monitoring instance is accessed read-only by default
- what "healthy" means in measurable terms - for the instrument and for the network it measures
- a daily, weekly and monthly check routine, and how to read the Overview dashboard in two minutes
- an alert-handling workflow with a triage tree: one stream, one AP, one DC or everything; fabric, firewall or platform
- how to run maintenance windows without false alarms (silences, mute timings, annotations)
- how to maintain the platform itself: TRex upgrade with rollback, OS patching and DPDK binding, host protection, InfluxDB/Grafana upgrades with version pinning, TX switches, backups and capacity checks
- how to document changes and hand over to on-call colleagues
Prerequisites: Chapter 5, Chapter 16, Chapter 17, Chapter 18, Chapter 19
The platform is a measuring instrument. Operating it means two things: keeping the instrument trustworthy, and reacting correctly when it reports something about the network. The order matters. Every check and every alert in this chapter starts with the same question - is the instrument healthy? - because a stopped exporter, a full disk or an unresolved TRex client produces symptoms that look exactly like network problems. Only when the instrument is known to be healthy do its numbers say something about the fabric, the DCI or the firewalls.
Chapters 21 and 23 contain the step-by-step scenarios (bring-up, adding VLANs and APs, maintenance windows, incidents). This chapter is the frame around them: roles, routines, workflows and platform maintenance.
The platform from an operator's point of view
Everything runs on one server, trex-rzk-01, plus the two TX switches. The table lists the components you will touch in
daily work. Configuration details are in Chapter 17 and
Chapter 18.
| Component | Runs as | You reach it with | Notes |
|---|---|---|---|
trex-mon (permanent monitoring) |
systemd unit trex-mon.service: t-rex-64 -i --software --emu --cfg /etc/trex/trex_mon.yaml --iom 0 |
./trex-console -r -p 4501 --async_port 4500 (read-only), EMU RPC port 4510 |
NIC1, p0/p1 active, p2/p3 reserve |
trex-lab (on-demand tests) |
trex-lab.service or trex-lab-astf.service, only one at a time; both start TRex with --no-scapy-server |
./trex-console -p 4601 --async_port 4600 |
NIC2, p4-p7, pinned to APs |
| Exporter | planned trexctl-exporter.service (part of trexctl) |
log file, Grafana "Ports and server" | Polls TRex, writes InfluxDB |
| InfluxDB OSS 2.x | influxdb.service, 127.0.0.1:8086 |
influx CLI |
Buckets trex (90 d) and trex_longterm (730 d) |
| Grafana | grafana-server.service |
https://trex-rzk-01/ |
Dashboards, alert rules, silences |
| TX switches | sw-rzk-TX1, sw-rzc-TX1 (stand-alone 5950) |
SSH via the management network | No production VLANs, no STP |
In the LVR platform: day one versus the planned tooling
The orchestrator trexctl (inventory, profiles, apply, status, the exporter) is specified but not yet
implemented. Until it exists, the monitoring profile is applied with a TRex console session or a small Python script,
and the TRex console and the Python API are your direct views. Every procedure in Part III therefore shows the native
method first and the planned trexctl command second. Grafana panels need the exporter: without it, Grafana has no
data to show.
Roles and access
Three roles work with the platform. They map to LVR teams, not to individual people - one person may hold more than one role.
| Role | Typical tasks | trex-rzk-01 |
Grafana | Network devices / firewall |
|---|---|---|---|---|
| Network operator | Watches the Overview dashboard, reacts to alerts, correlates loss with change tickets, runs predefined tests, sets silences and annotations | SSH (group trex), read-only TRex console, planned trexctl status / trexctl test ... |
Viewer or Editor (AD group) | display commands on Leafs, Border Leafs, TX switches |
| Platform administrator | Maintains inventory and profiles, adds VLANs and APs, upgrades TRex/InfluxDB/Grafana, manages tokens and backups | sudo, read-write TRex sessions during changes |
Admin | Configuration rights for AP ports and the TX switches |
| Firewall administrator | Maintains the TRex objects and rules, the firewall test zone interface, reports cluster state | none required | Viewer (firewall dashboards) | SmartConsole / Gaia |
Why the monitoring instance is read-only by default
TRex lets many clients connect to one server, but ports are owned exclusively: only one session can have read/write
control of a port, while any number of read-only clients may watch the statistics (TRex stateless guide, "RPC
Architecture - Control of TRex interfaces"). The console tries to acquire all ports when it starts. On trex-mon that
either fails (another session owns them), or succeeds because nobody owns them - the planned trexctl apply releases
the ports after it has started the streams (disconnect(stop_traffic=False, release_ports=True)), so the streams run
without an owner and your console would become the owner - or, with -f/--force, takes the ports away from the session
that owns them. None of these is what an operator wants: an owning console can stop the monitoring with a single
reset, stop or disconnect. Start the console read-only instead:
$ cd /opt/trex/current
$ ./trex-console -r -p 4501 --async_port 4500
trex(read-only)> stats -g
trex(read-only)> stats --ps
trex(read-only)> tui
verified options from the trex-console argument parser (trex_console.py), commands from
trex_stl_client.py.
In read-only mode stats, profiles (profile states per port) and tui work; start, stop, update and pause are
refused because they require acquired ports. The prompt shows trex(read-only)>. Two details avoid confusion:
- The per-stream counters you see start at zero when your console connects: every client takes a reference sample at
connect time and shows values relative to it (trex-core
trex_stl_stats.py, "Values we return are last - ref"). The console shows "what happened since I connected", not since the streams were started. streamslists the stream definitions only after they have been synchronised, which happens when ports are acquired. In a read-only session it may stay empty; useprofilesto see which profiles are loaded and transmitting.
Production impact: three console habits that protect the monitoring
- Never type
disconnectin a read-write session ontrex-mon. The console command calls the client'sdisconnect()with its defaultstop_traffic=Trueand stops the traffic on the acquired ports. Leaving the console withquit(or Ctrl+D) disconnects withstop_traffic=Falseand leaves the streams running (trex-coretrex_client.py,disconnect();trex_console.py,run_console()). - Never run
resetontrex-mon.resetforce-acquires the ports, stops the traffic and removes all streams (TRex STL API,reset()); the monitoring stays down until the profile is applied again. - In a read-write TUI, key
ppauses the ports you are looking at. The read-only TUI does not offer it (trex-coretrex_tui.py, dashboard key actions).
clear in a console only clears the statistics cached in your session ("Clear cached local statistics"); it does
not affect the exporter or other clients.
The EMU commands follow the same logic. emu_show_all, emu_show_client_info and emu_arp_show_cache only read;
emu_load_profile and emu_remove_profile replace or delete every emulated TRex host on the instance and belong to the
platform administrator: emu_load_profile first removes all namespaces and clients, so for a moment no TRex address
answers ARP. Plan EMU changes as incremental additions and removals (scenario S2 in
Chapter 21) or in a maintenance window. Load the EMU plugin with --emu when you need the
EMU view:
./trex-console -r -p 4501 --async_port 4500 --emu confirm on the bench (the EMU
plugin connects to port 4510 independently of port ownership).
Secrets and service identities
| Secret | Used by | Where it lives | Note |
|---|---|---|---|
| InfluxDB operator token | influx setup, influx backup, full restore |
Password safe | InfluxDB OSS 2.9 stores tokens hashed by default; a backup contains no plaintext operator token, so a full restore needs influx restore --full --operator-token ... |
InfluxDB write token (bucket trex) |
Exporter | /etc/trexctl/secrets.env, mode 0600 |
Scoped to one bucket |
| InfluxDB read token | Grafana data sources | Grafana provisioning | Read-only on trex, trex_longterm |
| Grafana service account token | Annotations from scripts / planned trexctl annotate |
Password safe | Needs annotations:create |
| Grafana local admin | Break-glass access if AD/LDAP fails | Password safe |
What "healthy" means
"Healthy" has two layers. The instrument layer says whether the numbers can be trusted; the network layer is what the numbers say about the fabric. Check them in this order.
Instrument health
| Check | Healthy | Where to look |
|---|---|---|
trex-mon running |
Unit active, no unexpected restarts | systemctl is-active trex-mon, systemctl show -p NRestarts trex-mon |
| TRex ports | p0 and p1 link up | console stats --ps |
| Streams transmitting | All profiles in state TX, stream count and total rate as planned (default profile: 74 latency + 102 flow-stat = 176 streams, about 20.6 kpps) | console profiles, stats -g; Overview "TX pps" |
| Queue mode (after every TRex start) | The start-up log contains set dpdk queues mode to ONE_QUE - the mode in which the software latency measurement is accurate (c: 1, Chapter 17) |
grep 'queues mode' /var/log/trex/trex-mon.log |
| EMU clients | Every client that needs a gateway reports dgw.resolve = true; 0 unresolved |
emu_show_all, emu_show_client_info ... --json; Overview "unresolved clients" |
| TRex CPU | cpu_util and rx_cpu_util stable and well below 50 %; queue_full not increasing |
console stats -g, stats -c, stats -m |
| Exporter | One write per interval (2 s), lag of a few seconds at most, no InfluxDB write errors | exporter log; Grafana "Ports and server" |
| InfluxDB | influx ping OK; downsampling task runs succeed |
influx ping, influx task run list --task-id <id> |
| Disk | /data below about 70 % |
df -h /data |
| Grafana | Data sources OK, alert rules evaluating (no rule in state Error) | Grafana UI: Alerting |
| TX switches | AP ports and TX-to-TX link up, error counters not increasing | display interface brief, display interface ... |
verified Comware commands in this chapter: 5950 Layer 2-LAN Switching Command Reference
R630x (display interface, PDF pp. 47-50; display interface brief, PDF p. 56) and Fundamentals Command Reference
R630x (display transceiver diagnosis, PDF pp. 290-291; display current-configuration, PDF p. 179).
Why trex-mon RX CPU deserves attention
trex-mon runs with --software: "all RX packets will be processed by software" (TRex manual, --software). Every
frame that reaches p0/p1 - the monitoring streams, but also broadcast and unknown-unicast traffic flooded out of the
monitored production VLANs at every AP - costs RX CPU. A rising rx_cpu_util without a profile change usually means
more flooded traffic arrives, not that TRex is broken.
Network health
| Check | Healthy |
|---|---|
| Loss | Every stream RX = TX: drop_pkts = 0 in every interval outside annotated events |
| Path | No stream with rx_pps = 0 while tx_pps > 0 ("path down") |
| Latency | Average and interval maximum per stream within the baseline band derived in scenario S1 (Chapter 21) |
| Jitter | Within the baseline band |
| Sequence errors | Latency streams: dropped, out_of_order, dup error counters not increasing |
"RX = TX" needs one qualification. At any instant a few packets are in flight, so a raw snapshot of TX minus RX is
slightly positive. The exporter works with per-interval deltas and the TRex rx_delay convention
(Chapter 18); a single drop that appears and disappears at an interval boundary is an
artefact, real loss persists. For latency streams the sequence-number counter dropped is an independent cross-check
that does not depend on polling boundaries (Chapter 5).
Daily, weekly and monthly routine
Daily (about five minutes)
- Overview dashboard: instrument row all green (instance up, exporter lag small, unresolved clients 0)
- No "path down" streams, no dropping streams in the last 24 hours that are not explained by an annotation
- Worst latency per class within the baseline band; no new step in the latency matrix
- Alert history of the last 24 hours reviewed; every firing alert has a ticket or an annotation
- No silence that should have expired is still active
On the server, the same picture in four commands:
systemctl is-active trex-mon influxdb grafana-server
systemctl show -p NRestarts trex-mon
df -h /data
influx ping
confirm on device unit names and paths as installed (Chapter 17).
Weekly (about 30 minutes)
-
/datausage trend (InfluxDB, reports, archives); growth roughly as expected - Exporter log: no InfluxDB write errors or buffer warnings
- Downsampling task:
influx task list, theninflux task run list --task-id <id>shows successful runs - TRex log (the file configured in the unit, for example
/var/log/trex/trex-mon.log) andjournalctl -u trex-mon --since "7 days ago": no restarts, no warnings - EMU: unresolved clients over the week (Grafana) - any client that flapped needs an explanation
- TX switches: error counters on AP ports and on the TX-to-TX link (
display interface), optical levels of the TX-to-TX link (display transceiver diagnosis interface ...) - Backups: last nightly InfluxDB and Grafana backups exist locally and on the LVR backup target
- Host protection active (the chosen firewall service runs, see Host protection) - especially
after a restart of
trex-monduring the week
Log rotation
A unit that writes with StandardOutput=append: keeps the log file open, so the file grows until something rotates
it. Rotate /var/log/trex/*.log with logrotate using copytruncate, otherwise rotation does not free the space.
Monthly (about two hours)
- Baseline review: compare the last 30 days per class with the baseline table; adjust thresholds only through a documented change
- Monitoring matrix versus reality: new Leafs, retired VLANs, changed firewall rules?
- Capacity: stream counts and packet rates against the budgets, TRex CPU trend, disk growth (section Capacity checks)
- Patch status: OS, TRex release notes, InfluxDB 2.x and Grafana security advisories
- Access review: AD group membership, tokens that are no longer used
- Quarterly: test restore of an InfluxDB backup on a scratch system
Reading the Overview dashboard
The Overview dashboard (Chapter 19) is built to be read top-down. The figure shows the reading order on an illustrative layout.
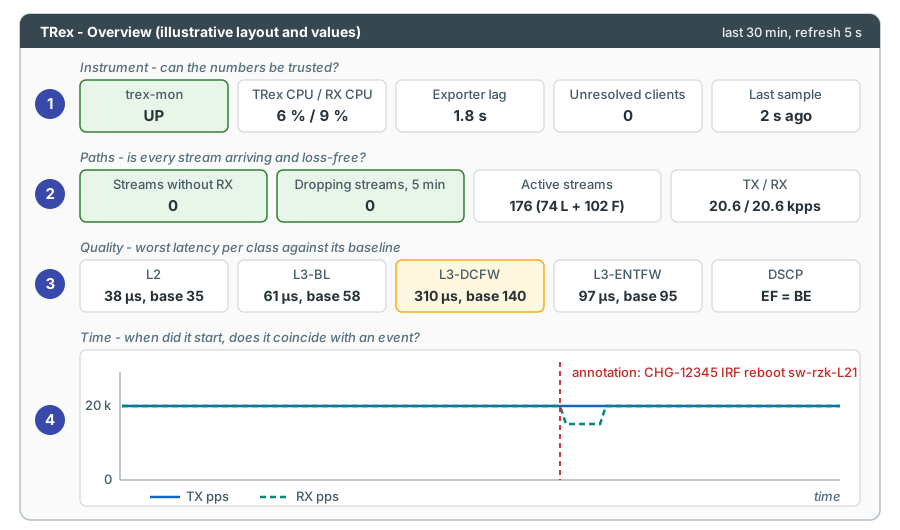
- Instrument row - instance state, TRex CPU and RX CPU, exporter lag, unresolved EMU clients. If any of these is not green, stop here: the other rows may show artefacts of the instrument problem, not the network.
- Path row - number of streams without RX ("path down") and number of streams with drops in the last five minutes. Both should be zero. A non-zero value is a count of streams, so it already tells you the scale: 2 means one pair, 24 probably means one AP or more.
- Quality row - worst latency per class (L2, L3-BL, L3-DCFW, L3-ENTFW, DSCP) next to its baseline. Remember the fixed offsets: RZC streams cross the TX-to-TX fibre once (RZK to RZC or RZC to RZK) or twice (RZC to RZC), so they always look slower than their RZK counterparts (Chapter 16).
- Time series and events - total TX and RX packet rate with annotations. Use it to answer "since when" and "does it coincide with a change, a maintenance window or a firewall event".
From the Overview, drill down by tag: the "Loss and outages" dashboard for drops per stream and outage durations, the
"Latency matrix" for source-AP by destination-AP comparisons, "Class detail" for one class, "Ports and server" for the
instrument itself. Filter by tags (class, dc_pair, src_ap, dst_ap, src_vlan) rather than by pg_id.
The console shows only a few streams
stats -s displays at most four pg_ids (latency streams first), stats -l and stats --lh at most five latency
pg_ids, and the TUI stream and latency views use the same functions (trex-core trex_stl_client.py,
_show_streams_stats() / _show_flow_latency_stats()). With about 176 streams the console is a spot-check tool. For the
complete table use Grafana or the Python API: get_active_pgids() lists all pg_ids and get_pgid_stats() returns up
to 1024 of them in one call.
A complete read-only status table needs only a few lines of Python. The sketch measures over a ten-second window
(counters are relative to the moment the client connects, see above) and reads the stream table that your apply script
(or later trexctl) writes, so that pg_ids get readable names:
import csv
import time
from trex.stl.api import STLClient

WINDOW = 10                                    # seconds
c = STLClient(server='127.0.0.1', sync_port=4501, async_port=4500)
c.connect()                                    # (1)!
names = {int(r['pg_id']): r['name']
         for r in csv.DictReader(open('/data/trexctl/state/stream-table.csv'))}  # (2)!
time.sleep(WINDOW)
active = c.get_active_pgids()
stats = c.get_pgid_stats()                     # (3)!
for pg in sorted(active['latency'] + active['flow_stats']):
    fs = stats['flow_stats'].get(pg, {})
    tx = fs.get('tx_pkts', {}).get('total', 0)
    rx = fs.get('rx_pkts', {}).get('total', 0)
    lat = stats['latency'].get(pg, {}).get('latency', {})
    print(f"{pg:5d} {names.get(pg, '?'):42s} tx={tx:<8d} rx={rx:<8d} "
          f"tx-rx={tx - rx:<5d} avg_us={lat.get('average', '-')} jitter_us={lat.get('jitter', '-')}")
c.disconnect(stop_traffic=False)               # (4)!
- No
acquire(): the script is a read-only client and cannot change the traffic. Its counters start at zero here. - Example path of the stream table (one row per stream with pg_id, name, class, APs, VLANs, rate).
- Empty list = all pg_ids. Keys
tx_pkts/rx_pktscontain per-port values andtotal. A difference of one or two packets is in-flight traffic at the window edges, not loss. - Always pass
stop_traffic=False- the default ofdisconnect()isTrue.
sketch - validate on the bench API names from the TRex STL Python API
(get_active_pgids, get_pgid_stats, disconnect).
Handling an alert
The workflow is the same for every alert. Its purpose is to narrow a symptom down to a scope (which streams) and a domain (fabric, firewall or platform) before anybody touches a device.
- Context. Is there an annotation, an active silence or a change ticket covering this time? Planned work explains most alerts.
- Instrument first. Overview instrument row: instance up, exporter lag small, data fresh, no unresolved clients. If not, the alert is a platform problem - see incident I7 in Chapter 23.
- Scope. Which streams are affected? Group them by the tags
class,src_ap,dst_ap,dc_pair,src_vlanand look at both directions of each pair. - Pattern. Match the pattern in the triage tree below.
- Verify. Run the device checks for that branch (tables below and Chapter 23).
- Decide. Network or firewall issue: escalate to the owning team with the evidence. Platform issue: fix it yourself or escalate to the platform administrator.
- Document. Annotation with the conclusion, ticket reference, and - if a threshold was wrong - a change request for the alert rule.
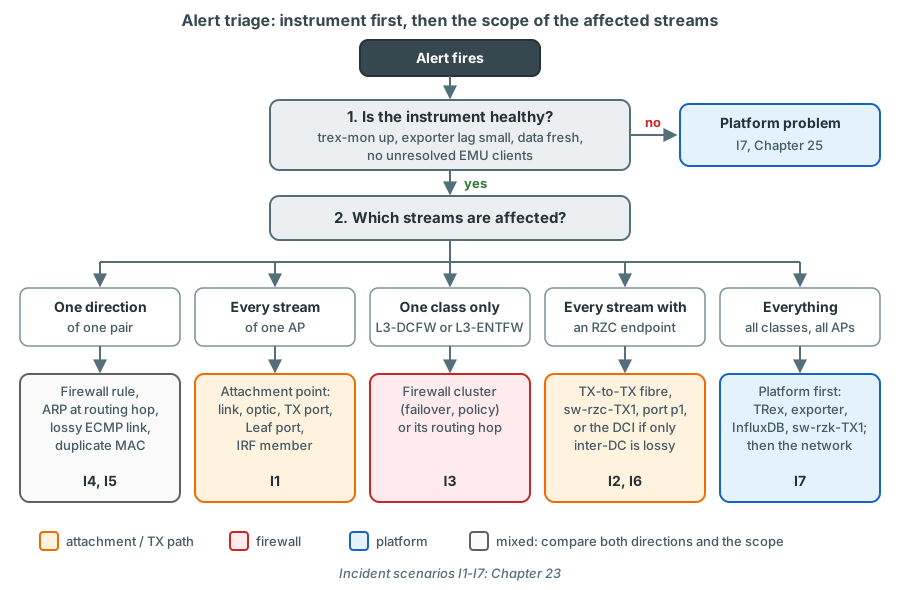
| Scope of affected streams | Most likely domain | First checks | Scenario |
|---|---|---|---|
| One direction of one pair | Firewall rule, ARP at the routing hop, one lossy ECMP member, duplicate MAC | Compare both pg_ids; display arp vpn-instance VPN-CORE on sw-rzk-BL; firewall logs |
I4, I5 |
| All streams of one AP, all classes | Attachment point: link, optic, TX switch port, Leaf port or IRF member | TX switch display interface brief; Leaf display l2vpn service-instance interface ... |
I1 |
| One class only (L3-DCFW or L3-ENTFW) | Firewall (cluster state, policy) or the routing hop | Latency step or loss? Loss that persists after a failover on streams sent to a firewall MAC (L3-DCFW, zone side of L3-ENTFW and DSCP): rebuild them with the new MAC. display arp vpn-instance VPN-CORE, firewall team |
I3 |
| Every stream with an RZC endpoint | TX-to-TX fibre, sw-rzc-TX1, TRex port p1, or the DCI |
Are intra-RZC streams affected too? TX-to-TX link counters and optics | I2, I6 |
| Everything | Platform (TRex, exporter, InfluxDB, sw-rzk-TX1) before network |
"No data" or "RX = 0"? systemctl status, read-only console |
I7 |
Why scope comes before devices
Every stream is a fixed, known path: source AP, destination AP, VLANs, class. A fault on one element hits exactly the streams whose path contains that element, and no others. Reading the set of affected streams is therefore a localisation method in itself - it is cheaper and safer than logging into ten switches.
Maintenance windows
Planned work on the fabric, the DCI or the firewalls will make streams lose packets. That is expected, and the platform should record it without paging anybody. Three Grafana tools are involved:
| Tool | What it does | Use it for |
|---|---|---|
| Silence | Suppresses notifications for alerts whose labels match, between a start and an end time | One-off maintenance windows (a change ticket) |
| Mute timing | A recurring time interval attached to a notification policy; notifications routed through that policy are suppressed during the interval | Recurring windows, for example a fixed monthly patch window |
| Annotation | A marker (point or region) with text and tags on the dashboards | Documenting what happened and when |
Silences and mute timings only stop notifications. Alert rules keep evaluating and alert instances still appear in the alerting UI (Grafana documentation, "Configure silences" and "Configure mute timings and active time intervals"). This is what you want: after the window you can see exactly which rules fired.
Before the window
- Silence the alerts of the affected scope. In Grafana: Alerts & IRM > Alerting > Silences >
Create silence, set start and end, and add label matchers for the affected streams - for example
src_ap=~K-L21|C-L21ordc_pair=rzk-rzc, using the labels your alert rules carry (Chapter 19). Prefer narrow matchers: a silence on everything hides unrelated problems during the window. -
Annotate the start. In a dashboard press Ctrl (Cmd on a Mac) and click on a graph to add an annotation, or Ctrl + drag to mark a region. From a script use the Grafana HTTP API:
Annotation from the shell (Grafana HTTP API, POST /api/annotations)curl -s -X POST https://trex-rzk-01/api/annotations \ -H "Authorization: Bearer $GRAFANA_SA_TOKEN" -H "Content-Type: application/json" \ -d "{\"time\": $(date +%s000), \"tags\": [\"maintenance\", \"CHG-12345\"], \"text\": \"Start: IRF member 2 reboot sw-rzk-L21\"}"time(andtimeEndfor a region) are epoch milliseconds. WithoutdashboardUIDthe annotation is an organisation annotation; dashboards show it through an annotation query filtered by tag. verified Grafana HTTP API documentation, "Annotations" (POST /api/annotations).Planned:
trexctl annotate "IRF reboot sw-rzk-L21 member 2"writes an event into InfluxDB (measurementtrex_event), which the dashboards display as an annotation. -
Decide on resolution. If the window is used to measure convergence, raise the affected groups to 1000 pps before the window starts (scenario S5 in Chapter 21, procedure M1 in Chapter 23). Latency streams ignore the multiplier, so latency groups are re-created at the new rate - early enough that the short gap of the re-creation lies outside the window.
During and after the window
- Watch "Loss and outages" and annotate every step with the exact time.
- Do not change the monitoring profile during the window except as planned.
- Afterwards: all streams back to RX = TX, rates restored, silence expired (or expire it manually), end annotation set, outcome recorded in the change ticket.
Production impact: silences and the firewall test zone
With the plan's default firewall-zone option B the zone lives in the existing transfer VSI 4003 and is reached through the Border Leaf attachment points, so no firewall interface depends on a TX switch: TX switch maintenance is a measurement-only event, and a silence is enough. If option A were chosen instead - a dedicated firewall interface per member on the TX switches (Chapter 15) - work on a TX switch or on the TX-to-TX fibre could affect the ClusterXL state of the Enterprise firewall, and TX switch maintenance would need the firewall team in the change, not just a silence.
Maintaining the platform
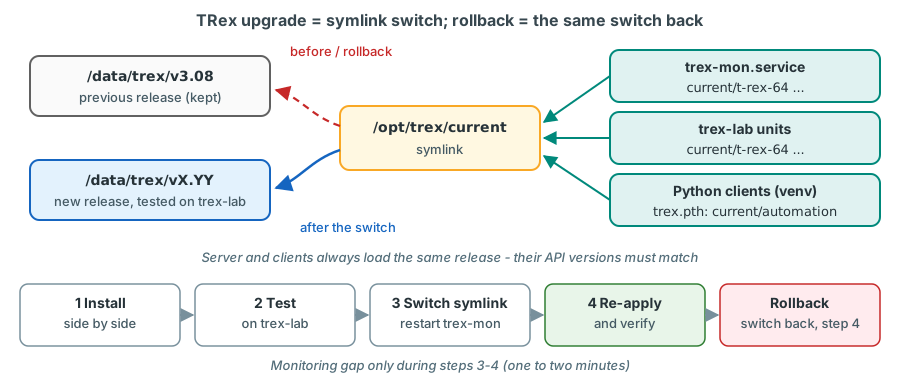
TRex upgrade with rollback
TRex releases are self-contained directories. The installation keeps every release under /data/trex/vX.YY and points
the symlink /opt/trex/current at the active one; the systemd units and the Python client path refer only to the
symlink (Chapter 17). An upgrade is therefore a symlink switch, and a rollback is the same
switch backwards.
- Read the release notes. Look for client-side Python requirements (v3.08: Python 3.12 support on the client side)
and known issues (v3.06 and later: bundled
libstdc++versus system libraries, see Chapter 17). - Install side by side. Download
https://trex-tgn.cisco.com/trex/release/vX.YY.tar.gzto/data/trex, verify the checksum, unpack. Re-apply thelibstdc++workaround in the new directory if it was needed before, and - if the host-protection decision below patchestrex-cfg- the patch as well. Run./t-rex-64 --helpin the new directory; like every call of the wrapper, this already runstrex-cfgand stops firewalld (see Host protection). - Test on the lab instance. Stop
trex-lab, start the new release by hand with the options of the unit (./t-rex-64 -i --cfg /etc/trex/trex_lab.yaml --iom 0 --no-scapy-serverin the new directory - without--no-scapy-serverthe start would restart the Scapy helper that the host shares withtrex-mon) and run a short test on a pinned AP pair or a DAC loopback. The monitoring keeps running on the old release confirm on the bench that two releases run side by side with their separate prefixes and NICs. -
Switch in an annotated, silenced window:
Restart every client as well (exporter, scripts): the Python client libraries are loaded from
/opt/trex/current/automation/trex_control_plane/interactive, and a client whose API version does not match the server is rejected at connect time ("Mismatch between client and server versions", trex-coretrex_conn.py). 5. Re-apply the monitoring profile - today with your apply script (EMU profile, port attributes, streams), later automatically: the supervisor thread of the planned exporter detects thetrex-monrestart (server uptime reset, oractive_streamsfalling to zero while a profile is recorded as active in/data/trexctl/state/), runstrexctl apply -p <active profile>once the server accepts connections again and restarts the gateway-MAC tracker. 6. Verify: the start-up log showsset dpdk queues mode to ONE_QUE,stats -gtotals as before, EMU clients resolved, Grafana streams continuous with the same pg_ids, host protection active. Expect a monitoring gap of one to two minutes. 7. Rollback if anything is wrong: switch the symlink back to the previous release, restart, re-apply. Keep at least one previous release on disk.
OS patching and DPDK binding
The X710 ports are bound to vfio-pci, and t-rex-64 re-applies the binding at every start. A kernel update therefore
needs no manual DPDK step if vfio-pci is used; igb_uio is an out-of-tree module that would have to be rebuilt for the
new kernel (and needs Secure Boot off) - one more reason to stay with vfio-pci. Patch in a maintenance window:
- Silence and annotate;
dnf update(pinned packages stay as they are, see below); reboot. -
After the reboot check the kernel parameters and hugepages, the binding and the instance:
cat /proc/cmdline                       # intel_iommu=on iommu=pt hugepages=...
grep -E 'HugePages_(Total|Free)' /proc/meminfo
cd /opt/trex/current && ./dpdk_setup_ports.py -s   # X710 ports bound to vfio-pci
tuned-adm active
systemctl status trex-mon
grep 'queues mode' /var/log/trex/trex-mon.log | tail -n 1   # set dpdk queues mode to ONE_QUE
systemctl is-active firewalld nftables  # host protection as decided (next section)
confirm on device paths as installed; the queue-mode line is printed at every start (
choose_mode()in trex-coresrc/trex_modes.cpp). -
Re-apply the monitoring profile and verify as after a TRex upgrade.
Host protection
Every start of t-rex-64 runs the script trex-cfg, and on Red Hat-family systems that script executes
systemctl stop firewalld.service (trex-core scripts/trex-cfg) - at boot, at every restart of trex-mon, at every
start of a lab unit, even for ./t-rex-64 --help. At the same time the TRex control ports (RPC 4501/4601, publisher
4500/4600, EMU 4510, Scapy server 4507) listen on all addresses and have no authentication: whoever reaches them can
start traffic into production VLANs. A host firewall built on firewalld is therefore switched off by the platform itself.
decision How the server is protected is a design decision of the server build
(Chapter 17, Appendix D) - for example
an nftables allow-list for the management hosts instead of firewalld, management-network ACLs, firewalld restarted
after every TRex start, or a patched trex-cfg that must be re-applied after every TRex upgrade. Whatever is chosen,
the operational rule is the same: after every TRex start, TRex upgrade and OS patch, check that the chosen protection
is active - systemctl is-active firewalld nftables shows which of the two services is running, and ss -ltnp lists
the TRex listeners. The control ports must not be reachable from outside the management hosts; the exporter, the
scripts and the consoles run on the server itself and connect to 127.0.0.1.
InfluxDB and Grafana upgrades with version pinning
Both products move fast, and an unplanned major upgrade can break the pipeline. InfluxDB 3 is a different product with a
different storage engine and API; the platform stays on InfluxDB OSS 2.x (2.9.x at the time of writing), and a routine
update must never move it to version 3. Grafana stays on the chosen line (12.4.x or 13.x). Pin the packages so that
a routine dnf update cannot change them:
dnf install python3-dnf-plugin-versionlock
dnf versionlock add influxdb2 influxdb2-cli grafana
dnf versionlock list
confirm on the target OS package names of the installed repositories.
An upgrade is then a deliberate change:
- Back up first (next section) and read the release notes.
dnf versionlock delete <package>, upgrade one product, lock the new version again.- Verify InfluxDB with
influx ping, a query from Grafana and a successful run of the downsampling task; verify Grafana with a data-source test, the dashboards and the alert rule states. Provisioned data sources, dashboards and alert rules are re-read from their files at start-up.
TX switches
The TX switches need no routine changes. Keep them on the release chosen at installation (the same as the Border Leafs, see Chapter 12). The 5950 models reach end of support on 31 October 2026 (4-slot chassis JH404A) and 28 February 2026 (32QSFP28 model JH321A), so keep a configured cold spare and the current configuration in the repository. A successor model needs the same functions (QinQ access ports, 802.1Q trunks, no STP, no production VLANs); re-validate every command for that platform before replacing a TX switch.
Backups
| What | How | Retention |
|---|---|---|
| InfluxDB (data and metadata) | Nightly influx backup /data/backup/influx-$(date +%F) -t "$INFLUX_OPERATOR_TOKEN" |
14 days locally, copy to the LVR backup target |
| Grafana database (users, alert state, silences, annotations) | Nightly: stop grafana-server, copy /var/lib/grafana/grafana.db, start again (Grafana recommends stopping the service for a consistent SQLite copy) |
As above |
Inventory, profiles, raw TRex and EMU profiles, dashboards, alert rules, systemd units, /etc/trex/*.yaml |
Git repository | Full history |
trexctl state /data/trexctl/state/ (pgid-map.json, applied-<profile>.json, exporter state) |
Nightly server backup; pgid-map.json is also copied into the git repository whenever it changes |
Full history of the pg_id map |
| Switch configurations (TX switches, AP port blocks on Leafs and Border Leafs) | display current-configuration after every change, stored in the repository |
Full history |
| Test reports and pcaps | /data/trexctl/reports, /data/trexctl/archive in the server backup |
Per LVR policy |
The file you must never lose: the pg_id map
Grafana history is keyed by tags, and the pg_id allocation in /data/trexctl/state/pgid-map.json keeps the mapping
between a stream and its pg_id stable across restarts. If the file is lost, re-applying the profile allocates new
pg_ids and the history of every stream is split in two. It is written by the trexctl service user, hence it lives
under /data and not in /etc/trexctl/; it belongs in the nightly backup, and a copy goes into git whenever it
changes.
Capacity checks
| Metric | Default profile | Guard rail | Hard limit | Where to read it |
|---|---|---|---|---|
Latency streams (STLFlowLatencyStats) |
74 | 120 | 128 per TRex instance | get_active_pgids()['latency'], Grafana |
Flow-stat streams (STLFlowStats, --software) |
102 | 600 | 1023 | get_active_pgids()['flow_stats'] |
| Total packet rate | about 20.6 kpps | 50 kpps | - | stats -g, Overview |
| Rate per stream through a firewall | 50 pps | 100 pps | - | profile |
| TRex CPU / RX CPU | low, stable | investigate sustained > 50 % | - | stats -c, stats -g |
/data usage |
grows with retention | 70 % | - | df -h /data |
The latency budget is the scarce resource: 128 latency streams per instance, independent of the flow-stat budget (Chapter 16). Every request for "latency on one more VLAN" is a request for more of these 128 streams; loss-only coverage costs flow-stat streams, of which there are plenty. If the latency budget is ever exhausted, the documented way out is a second monitoring instance on p2/p3 with its own 128 latency streams - which must be validated on the bench first.
Disk alerts
The design has no host-metrics collector, so /data is checked in the weekly routine. If you want an alert, add host
metrics (for example a collector writing into a separate InfluxDB bucket) as a documented platform change.
Documentation and change management
- Git for everything declarative. Inventory, profiles, raw TRex and EMU profiles, the stream table,
Grafana provisioning (dashboards, alert rules, contact points), systemd units,
/etc/trex/*.yaml, switch configuration snapshots and a copy of/data/trexctl/state/pgid-map.jsonwhenever it changes. Commit messages carry the ticket number. Whentrexctlexists, a pre-commit hook runstrexctl inventory validateandtrexctl plan(planned). - What needs an LVR change ticket. Anything that touches production devices (Leaf and Border Leaf AP ports, firewall objects and rules), lab tests through production firewalls or across the DCI, and any rate increase beyond the budget. Platform-internal work (dashboards, a TRex upgrade) is a standard change of the platform owner, announced to the network team.
- Before/after snapshots. For every switch change,
display current-configuration interface <port>before and after, stored with the ticket. - Operations handbook. The baseline table from scenario S1, the escalation matrix and the list of known benign effects below.
Handover and on-call notes
Hand over with a short written note: open alerts and their status, active silences and their end times, changes in progress, raised rates that still need to be restored, anomalies under observation.
The on-call engineer should know these points by heart:
- Instrument first. Check the Overview instrument row before interpreting any loss or latency.
- Known benign effects. A Leaf IRF member reboot takes down the AP on that member for the whole reboot (APs are single links by design). A firewall failover shows as a short loss followed by a latency step on the firewall classes. RZC streams are always slower than RZK streams by the TX-to-TX fibre offset.
- After a firewall failover, rebuild the streams sent to a firewall MAC. The firewall clusters answered with member
MACs in February 2025. Streams whose destination MAC is a firewall MAC - all L3-DCFW streams and the zone-side
L3-ENTFW and DSCP streams - keep the old MAC and lose packets until they are re-created with the newly resolved MAC
(incident I3 in Chapter 23). The planned
trexctldoes this automatically: its gateway-MAC tracker pollsdgw.rmacevery 10 s, rebuilds the affected streams and writes the eventgateway_mac_changed, which raises the information alert "Gateway MAC changed". - Do not restart
trex-monto "fix" a network alert. A restart loses the in-memory counters, creates a gap and changes nothing in the network. - Emergency stop of a lab test.
systemctl stop trex-lab.service(ortrex-lab-astf.service) stops all lab traffic immediately. Monitoring keeps running. - Isolating the platform from one Leaf.
shutdownon the AP port of the TX switch removes the platform from that Leaf completely; the Leaf sees a link down on an unused trunk port. Only the measurements are affected. - Escalation. Fabric and DCI: network team. Firewall classes: firewall team. Server, TRex, InfluxDB, Grafana: platform administrator.
Key takeaways
- The platform is an instrument: always establish instrument health (instance, exporter, EMU, disk) before interpreting network symptoms.
- Access
trex-monread-only (trex-console -r). Ports are owned exclusively;disconnectin a read-write session andresetstop the monitoring,quitdoes not. - "Healthy" is measurable: RX = TX per stream, no path down, latency and jitter within the baseline, 0 unresolved EMU clients, low and stable TRex CPU, small exporter lag, enough disk.
- The console shows only four (streams) or five (latency) pg_ids; use Grafana or
get_pgid_stats()for the full picture. - Triage by scope: one direction, one AP, one class, all RZC streams or everything - each scope points to a domain.
- Use silences for one-off maintenance windows, mute timings for recurring ones, annotations for both; none of them stop alert evaluation.
- Upgrades are reversible by design: TRex releases side by side behind a symlink, InfluxDB 2.x and Grafana pinned with
dnf versionlock, backups before every upgrade. - Every TRex start stops firewalld: after starts, upgrades and patches check the queue mode (
ONE_QUE) and the host protection. - Keep the inventory and the profiles in git and
/data/trexctl/state/pgid-map.jsonin the backup (with a copy in git whenever it changes) - they are what makes the history continuous.
Check your understanding
1. An operator starts ./trex-console -p 4501 --async_port 4500 on the server and gets an error that the ports could not be acquired. What happened, and what should he do?
The console tries to acquire all ports at start-up, and another session (the apply script or a colleague's
read-write console) owns the trex-mon ports - TRex allows only one read/write session per port. He should start
the console read-only with -r. He must not use -f/--force: that would take the ports away from the owning
session. Note that the planned trexctl apply releases the ports after it has started the streams, so with trexctl
the acquire would succeed - and the read-write console would then be able to stop the monitoring; -r is the right
choice in both cases.
2. The Overview shows 24 streams without RX and an exporter lag of 900 s. What do you investigate first, and why?
The exporter lag. With a lag of 15 minutes the dashboard data is stale, so the "streams without RX" count may be an
artefact of the pipeline rather than a network fact. Check the exporter process and its log, InfluxDB (influx ping,
df -h /data) and only then the network.
3. During a maintenance window you silenced all alerts with dc_pair=rzk-rzc. After the window, can you still see which rules fired? Why?
Yes. Silences (and mute timings) only suppress notifications; alert rules keep evaluating and alert instances still appear in the alerting UI and its history. That is why silences are preferred over disabling rules.
4. Why is a sudden rise of rx_cpu_util on trex-mon, without any profile change, often a network observation rather than a TRex problem?
trex-mon runs in software mode, so every received frame is processed by software. Besides the monitoring streams,
the TRex ports receive the broadcast and unknown-unicast traffic flooded in the monitored VLANs at every AP. More
flooding in those VLANs therefore shows up as more RX CPU.
5. A colleague wants to upgrade TRex by unpacking the new release over the existing directory. What is wrong with that, and what is the procedure instead?
It destroys the rollback path and changes the running installation in place. Releases are installed side by side
under /data/trex/vX.YY, tested on the lab instance, and activated by switching /opt/trex/current and restarting
trex-mon (then re-applying the profile). Rollback is the same switch backwards. All clients must be restarted too,
because client and server API versions must match.
6. Why is pgid-map.json more important for the history than the InfluxDB backup of last night?
The InfluxDB backup protects the data already written. /data/trexctl/state/pgid-map.json keeps future data
continuous: it maps each stream to the same pg_id after every re-apply. Without it, new pg_ids are allocated and
every stream's history splits into an "old" and a "new" series.
7. Only the L3-ENTFW streams show a latency step; L2 and L3-BL streams are unchanged. Which domain does the triage tree point to, and which scenario covers it?
A single class is affected, so the cause is in an element only that class traverses: the Enterprise firewall (for example a cluster failover moving the active member to the other DC) or its routing hop. Incident I3 in Chapter 23 covers it.
References
- TRex stateless support guide, https://trex-tgn.cisco.com/trex/doc/trex_stateless.html - sections "RPC Architecture"
(control of TRex interfaces, read-only clients), "Port service mode", "Per stream latency/jitter/packet errors"
(limitations); TRex manual https://trex-tgn.cisco.com/trex/doc/trex_manual.html - command-line option
--software. - TRex STL Python API, https://trex-tgn.cisco.com/trex/doc/cp_stl_docs/api/client_code.html -
reset(),get_active_pgids(),get_pgid_stats()(max 1024 pg_ids per call),disconnect(). - trex-core source (master),
scripts/automation/trex_control_plane/interactive/trex/:console/trex_console.py(options-r/--readonly,-f/--force,--emu;run_console()disconnects withstop_traffic=False),common/trex_client.py(disconnect(stop_traffic=True, ...),clear= "Clear cached local statistics"),stl/trex_stl_client.py(_show_streams_stats()4 pg_ids,_show_flow_latency_stats()5 pg_ids),console/trex_tui.py(pause only on acquired ports),common/trex_conn.py("Mismatch between client and server versions"),stl/trex_stl_stats.py(per-stream counters relative to the client's reference sample; the reference is taken at connect and onclear),emu/trex_emu_client.py(load_profileremoves all namespaces first). Server side:src/trex_modes.cpp(choose_mode(), log line "set dpdk queues mode to ..."),scripts/t-rex-64andscripts/trex-cfg(systemctl stop firewalld.serviceon Red Hat-family systems). - Grafana documentation: "Configure silences", "Configure mute timings and active time intervals"
(https://grafana.com/docs/grafana/latest/alerting/configure-notifications/), "Annotate visualizations"
(https://grafana.com/docs/grafana/latest/dashboards/build-dashboards/annotate-visualizations/), HTTP API "Annotations"
(
POST /api/annotations), upgrade guide "Back up Grafana" (SQLite database/var/lib/grafana/grafana.db). - InfluxDB OSS v2 documentation: "Back up data" and "Restore data" (token hashing default in 2.9,
--operator-token), https://docs.influxdata.com/influxdb/v2/admin/backup-restore/;influx ping; "View task run history" (influx task run list). - HPE FlexFabric 5950 Switch Series Layer 2-LAN Switching Command Reference, Release 630x:
display interface, PDF pp. 47-50;display interface brief, PDF p. 56. HPE FlexFabric 5950 Switch Series Fundamentals Command Reference, Release 630x:display transceiver diagnosis, PDF pp. 290-291;display current-configuration, PDF p. 179. - Platform design document (plan v0.92, 14 October 2026), sections 9.10, 10.4-10.6, 11.1 and 11.12 - supervisor thread, dashboards, alert rules, backup and housekeeping, roles, platform maintenance.