18. Orchestration and the data pipeline
In this chapter
You will learn
- why the platform needs an orchestrator, what the planned tool trexctl will do - and that it is specified but not yet implemented
- the trexctl architecture, the inventory and profile formats, and how one profile group becomes TRex streams and EMU clients
- why EMU clients are changed incrementally, how the gateway-MAC tracker rebuilds streams after a firewall failover, and why streams are also rebuilt when a latency rate changes
- how a TRex counter becomes a point in InfluxDB: polling, per-interval deltas, packets in flight, restarts, and why the per-interval latency maximum must be derived from the histogram
- the InfluxDB data model, and which fields a latency stream and a flow-stat stream carry
- how to run a minimal monitoring runner and exporter with native TRex today
- how the orchestrator is run as a service, kept under version control and accepted
Prerequisites: Chapter 5 (flow statistics and latency streams), Chapter 6 (EMU), Chapter 8 (InfluxDB), Chapter 16 (the monitoring profile), Chapter 17 (the server).
In the foundation chapters you started one stream at a time from the console. The LVR monitoring profile has 176 streams on two TRex ports, two kinds of statistics, dozens of EMU clients - one per attachment point and VLAN, each in its own double-tagged namespace - and every number has to arrive in InfluxDB every two seconds with the tags that tell Grafana which path it belongs to. Doing that by hand is not an option, and doing it with ad-hoc scripts produces exactly the problems that make a monitoring system untrustworthy: pg_ids that change after a restart, gaps nobody notices, loss that is really a counting artefact.
This chapter has two halves. The first describes trexctl, the orchestrator the plan specifies. The second follows a TRex counter through the data pipeline into InfluxDB and Grafana, explains every trap on the way, and ends with a small runner you can use with native TRex while trexctl does not exist.
Why an orchestrator?
| Task | With native TRex only | With trexctl (planned) |
|---|---|---|
| Describe the environment | In your head, in tables | inventory.yaml: APs, S-VLANs, TRex ports, VLANs, pools, gateways |
| Create 176 streams | Write a Python profile by hand, keep MACs, IPs, tags and pg_ids consistent yourself | Expand short stream groups from a profile file, validate against the budget |
| Keep pg_ids stable | Nothing prevents renumbering - Grafana history breaks | pg_ids allocated once and persisted in /data/trexctl/state/pgid-map.json |
| EMU clients | One EMU profile per change, written by hand - and reloading it removes every client | Derived from the streams: one client per AP and VLAN, deterministic MAC and IP, changed incrementally |
| Export statistics | Not part of TRex: counters live in the server and are lost on restart | Exporter daemon: deltas, loss, latency, tags, buffering, InfluxDB |
| Repeatable tests | Console sessions, results copied by hand | Test runners (throughput, soak, convergence, ASTF) with reports |
| Change control | Hard to review | Inventory and profiles in git; trexctl plan shows the effect before apply |
trexctl does not exist yet
trexctl is a project deliverable specified in section 9 of the plan document; the plan estimates 15-18 person-days for
its core and test runners. Everything in this chapter that starts with trexctl describes the planned behaviour.
Until the tool is delivered and accepted, the platform runs on native TRex - the console and the Python API - and the
section Native TRex today shows how.
Architecture
trexctl is a Python 3.12 command-line tool plus a small daemon (the exporter), installed in the virtual environment of Chapter 17. It talks to TRex only through the public APIs: the STL client (RPC port 4501 for trex-mon, 4601 for trex-lab) and the EMU client (port 4510).
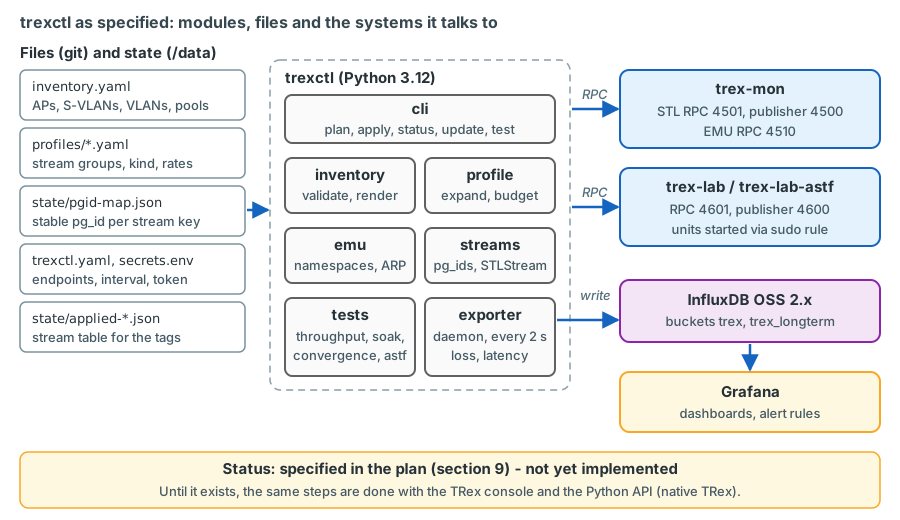
| Module | Responsibility |
|---|---|
trexctl.inventory |
Loads and validates inventory.yaml; derives client IP and MAC per AP and VLAN; renders Comware snippets for Leaf/BL AP ports and TX-switch ports |
trexctl.profile |
Loads profiles/*.yaml; expands stream groups into concrete unidirectional streams; checks the budget per stream kind |
trexctl.emu |
Builds the EMU namespaces (one per TRex port, S-VLAN and C-VLAN) and clients (one per address), adds and removes them incrementally, waits for gateway resolution and keeps watching the resolved gateway MACs (the gateway-MAC tracker) |
trexctl.streams |
Allocates pg_ids, builds the Scapy packets and STLStream objects, adds them per port and group, starts, stops and rebuilds them |
trexctl.exporter |
Read-only daemon (never acquires a port): polls the statistics every 2 s, computes per-interval values, writes InfluxDB line protocol with the stream tags; its supervisor thread re-applies the active profile after a trex-mon restart and restarts the gateway-MAC tracker |
trexctl.tests |
Lab test runners (throughput, soak, convergence, ASTF) producing JSON/Markdown reports and InfluxDB records |
trexctl.cli |
The command-line front end and status tables |
/opt/trexctl/                       git checkout: package, venv, schemas, dashboards, alert rules
/etc/trexctl/inventory.yaml         the environment (single source of truth)
/etc/trexctl/profiles/*.yaml        monitoring-default.yaml, dscp-check.yaml, lab-*.yaml
/etc/trexctl/trexctl.yaml           tool settings: TRex endpoints, InfluxDB URL, polling interval, budget
/etc/trexctl/secrets.env            INFLUX_TOKEN=... (mode 0600)
/data/trexctl/state/                exporter state, applied-<profile>.json stream tables,
                                    pgid-map.json (persisted pg_id allocation, managed by trexctl)
/data/trexctl/reports/              test reports
/var/log/trexctl/                   logs
The inventory
The inventory describes the world as TRex sees it. Everything else - addresses, MACs, tags, even the Comware snippets for new attachment points - is derived from it.
version: 1
site: { name: LVR RZK/RZC, mac_oui: "02:54:52" }       # locally administered prefix for TRex clients
trex:
  mon: { server: 127.0.0.1, rpc_port: 4501, pub_port: 4500, emu_port: 4510, mode: stl-software-emu }
  lab: { server: 127.0.0.1, rpc_port: 4601, pub_port: 4600, mode: stl-hw }
ports:                                                  # TRex port numbers as each instance counts them
  mon:
    0: { type: multiplexed, tx_switch: sw-rzk-TX1, tx_port: XGE1/1/21, default_for: [rzk] }
    1: { type: multiplexed, tx_switch: sw-rzk-TX1, tx_port: XGE1/1/22, default_for: [rzc] }
  lab:                                                  # keys = trex-lab port numbers; label = server-wide name
    0: { label: p4, mac: "02:54:52:f0:00:04", type: pinned,
         tx_switch: sw-rzk-TX1, tx_port: XGE1/1/9,  ap: K-L11, astf_role: client }
    1: { label: p5, mac: "02:54:52:f0:00:05", type: pinned,
         tx_switch: sw-rzk-TX1, tx_port: XGE1/1/10, ap: K-L41 }
    2: { label: p6, mac: "02:54:52:f0:00:06", type: pinned,
         tx_switch: sw-rzk-TX1, tx_port: XGE1/1/11, ap: FWZ,   astf_role: server }
    3: { label: p7, mac: "02:54:52:f0:00:07", type: pinned,
         tx_switch: sw-rzk-TX1, tx_port: XGE1/1/12, ap: C-L21 }
# the lab-port MACs must match src_mac in /etc/trex/trex_lab.yaml and trex_lab_astf.yaml
vlans_under_test: &utv [1314, 1315, <PROD-VLAN-A>, <PROD-VLAN-B>]   # carried by every Leaf/BL AP
aps:
  K-L11: { index: 1,  dc: rzk, device: sw-rzk-L11, device_port: Ten-GigabitEthernet1/3/1,
           tx_switch: sw-rzk-TX1, tx_port: XGE1/1/1, svlan: 3101, vlans: *utv }
  K-BL:  { index: 6,  dc: rzk, device: sw-rzk-BL, device_port: Ten-GigabitEthernet1/3/6,
           tx_switch: sw-rzk-TX1, tx_port: XGE1/1/6, svlan: 3110,
           vlans: [1314, 1315, <PROD-VLAN-A>, <PROD-VLAN-B>, 4003] }   # BL: VLANs under test + zone VLAN
  C-L21: { index: 10, dc: rzc, device: SW-RZC-L21, device_port: Ten-GigabitEthernet1/4/4,
           tx_switch: sw-rzc-TX1, tx_port: XGE1/1/4, svlan: 3204, vlans: *utv }
  C-BL:  { index: 13, dc: rzc, device: sw-rzc-BL, device_port: Ten-GigabitEthernet1/3/14,
           tx_switch: sw-rzc-TX1, tx_port: XGE1/1/7, svlan: 3210,
           vlans: [1314, 1315, <PROD-VLAN-A>, <PROD-VLAN-B>, 4003] }
  # ... the remaining nine attachment points of the AP / S-VLAN plan, all with vlans: *utv
  FWZ:   { alias_of: K-BL, vlan: 4003 }                 # firewall zone, option B (default): no AP of its own
  # FW:  { index: 14, dc: both, device: CPF-ZV01/ZV02, device_port: TBD, tx_switch: both,
  #        tx_port: XGE1/1/7+XGE1/1/8, svlan: 3300, vlans: [1420] }        # firewall zone, option A only
vlans:
  1314: { vsi: VPN-1314, prefix: 10.3.14.0/24, gateway: 10.3.14.1, gateway_owner: sw-rzk-BL/VPN-CORE,
          pool_start: 10.3.14.101, lab_pool_start: 10.3.14.151, vrf: VPN-CORE }
  1315: { vsi: VPN-1315, prefix: 10.3.15.0/24, gateway: 10.3.15.1, gateway_owner: sw-rzk-BL/VPN-CORE,
          pool_start: 10.3.15.101, lab_pool_start: 10.3.15.151, vrf: VPN-CORE }
  4003: { vsi: VPN-4003, prefix: 10.9.90.0/24, gateway: 10.9.90.1, gateway_owner: ENT-FW,
          pool_start: 10.9.90.101, lab_pool_start: 10.9.90.151, vrf: FW-ZONE, gateway_mac_tracking: true }
  # 1420: { prefix: 10.9.90.0/24, gateway: 10.9.90.1, gateway_owner: ENT-FW, pool_start: 10.9.90.101,
  #         lab_pool_start: 10.9.90.151, vrf: FW-ZONE, gateway_mac_tracking: true }   # option A only
  <PROD-VLAN-A>: { vsi: VPN-A, prefix: <SUBNET-A>, gateway: <GW-A>, gateway_owner: DC-FW,
                   pool_start: <POOL-A>, vrf: DC-FW, gateway_mac_tracking: true }
budget: { max_latency_streams: 120, max_flowstat_streams: 600, max_pps: 50000, max_bps: 50000000,
          max_pps_per_fw_stream: 100 }
decision The firewall-zone entries follow option B, which the plan recommends and
uses as the default (Chapter 15). The zone is VLAN 4003 behind the Border Leaf attachment points,
so it needs no attachment point of its own: K-BL and C-BL simply carry VLAN 4003, and FWZ is an alias for "K-BL in
VLAN 4003" that the lab pins and the test commands use (--dst FWZ --dst-vlan 4003). A lab port pinned to FWZ - p6 -
therefore sits in K-BL's S-VLAN 3110 and sends with the tag 4003. With option A, the commented FW attachment point
(index 14, S-VLAN 3300, VLAN 1420) would take the place of the alias and of VLAN 4003 at the BL APs - it exists in the
inventory only then. vlans_under_test is a YAML anchor: every Leaf AP carries the same list (*utv), because the
loss-only coverage groups and the L3-DCFW class need the production VLANs at every attachment point; the two BL entries
list the VLANs explicitly, because YAML cannot splice an alias into a longer list, and add the zone VLAN 4003.
astf_role marks the two lab ports that trexctl test astf writes into
/etc/trex/trex_lab_astf.yaml: p4 as the client side, p6 as the server side (Chapter 17).
confirm on device Device ports marked "free" in February 2025 must be re-checked.
The validator enforces simple rules that prevent the classic mistakes: S-VLANs and AP indexes unique (index 1-49; lab
IPs use index + 50 in the lab pool); lab-port MACs unique and equal to the src_mac entries of the TRex configuration
files; every VLAN referenced by an AP exists; the monitoring pool and the lab pool (16 addresses each)
stay inside the prefix and overlap neither each other nor the gateway; and every VLAN whose gateway is a firewall
cluster carries gateway_mac_tracking: true - in the excerpt the zone VLAN 4003 and the production VLANs behind the
DC-FW. trexctl inventory render-leaf and the acceptance checks also verify that the VSI of every listed VLAN exists
on the Leaf. From index and VLAN follow the client identities of Chapter 16:
IP = pool start + (index - 1), MAC = 02:54:52:<index>:<VLAN high byte>:<VLAN low byte>. K-L11 in VLAN 1314 is therefore
always 10.3.14.101 / 02:54:52:01:05:22, and C-L21 in VLAN 1314 always 10.3.14.110 / 02:54:52:0a:05:22. The zone clients
follow the same rule (VLAN 4003 = 0x0FA3): K-BL in VLAN 4003 is 10.9.90.106 / 02:54:52:06:0f:a3, C-BL in VLAN 4003 is
10.9.90.113 / 02:54:52:0d:0f:a3. The lab clients are different: a lab port keeps one fixed MAC (mac: in ports.lab,
equal to src_mac in the TRex configuration - 02:54:52:f0:00:04 for p4 ... :07 for p7) whatever it is pinned to,
because TRex answers ARP for a lab port with the port MAC and the pin changes over time; only its IP follows the pinned
AP, lab pool start .151 + (index - 1). The lab client of p6 at FWZ = K-BL (index 6) is therefore
10.9.90.156 / 02:54:52:f0:00:06, and p4 at K-L11 in VLAN 1314 is 10.3.14.151 / 02:54:52:f0:00:04.
Profiles
A profile describes the wanted traffic as stream groups. Each group says which class, which stream kind, which VLANs,
which AP pairs, rate, size and TOS; trexctl expands it into concrete streams. The kind decides what TRex measures:
latency streams use STLFlowLatencyStats (loss, latency, jitter, sequence errors; at most 128 per instance),
flowstat streams use STLFlowStats (loss only; up to 1023 in software mode).
version: 1
name: monitoring-default
instance: mon
defaults: { kind: latency, pps: 200, size: 128, tos: 0, ttl: 64, bidir: true, dport_base: 32000, sport_base: 40000 }
groups:
  - { name: l2-intra-rzk, class: L2, kind: latency, vlans: [1314],
      pairs: [[K-L11, K-BL], [K-L12, K-BL], [K-L21, K-BL], [K-L31, K-BL], [K-L41, K-BL]] }
  - { name: l2-intra-rzc, class: L2, kind: latency, vlans: [1314],
      pairs: [[C-L11, C-BL], [C-L12, C-BL], [C-L13, C-BL], [C-L21, C-BL], [C-L22, C-BL], [C-L23, C-BL]] }
  - { name: l2-inter-dc, class: L2, kind: latency, vlans: [1314],
      pairs: [[K-L11, C-L11], [K-L12, C-L12], [K-L21, C-L21], [K-L31, C-L22], [K-L41, C-L23], [K-BL, C-BL]] }
  - { name: l2-coverage-1315, class: L2, kind: flowstat, vlans: [1315], pps: 100,
      pairs_from: [l2-intra-rzk, l2-intra-rzc, l2-inter-dc] }                    # (1)!
  - { name: l2-coverage-prod, class: L2, kind: flowstat, vlans: [<PROD-VLAN-A>, <PROD-VLAN-B>], pps: 100,
      pairs_from: [l2-intra-rzk, l2-intra-rzc, l2-inter-dc] }
  - { name: l3-bl, class: L3-BL, kind: latency, src_vlan: 1314, dst_vlan: 1315,
      pairs: [[K-L11, K-L21], [K-L31, K-BL], [C-L21, C-L22], [C-L13, C-BL]] }
  - { name: l3-dcfw, class: L3-DCFW, kind: latency, src_vlan: <PROD-VLAN-A>, dst_vlan: <PROD-VLAN-B>, pps: 50,
      pairs: [[K-L11, K-L41], [K-L21, K-L31], [C-L12, C-L23], [C-L11, C-L22]] }
  - { name: l3-entfw, class: L3-ENTFW, kind: latency, src_vlan: 1314, dst_vlan: 4003, pps: 50,
      pairs: [[K-L11, K-BL], [K-BL, K-BL], [C-L21, C-BL], [C-BL, C-BL]] }       # (2)!
  - { name: dscp-l2-interdc, class: DSCP, path: L2, kind: latency, vlans: [1314], pps: 100, size: 256,
      tos_set: [0x00, 0xB8, 0x88, 0x20], pairs: [[K-L11, C-L21]] }             # (3)!
  - { name: dscp-entfw, class: DSCP, path: L3-ENTFW, kind: latency, src_vlan: 1314, dst_vlan: 4003, pps: 50,
      size: 256, tos_set: [0x00, 0xB8, 0x88, 0x20], pairs: [[K-L11, K-BL]] }
tags: { environment: prod, owner: netzwerk }
pairs_fromre-uses the pair lists of the three L2 latency groups (5 + 6 + 6 = 17 pairs): 17 pairs × 2 directions = 34 loss-only streams in VLAN 1315.l2-coverage-proddoes the same in the two production VLANs: 68 streams. The loss-only coverage is split by VLAN, not by pair set.- For the L3 classes the destination is the client of
dst_vlanat the second AP of the pair.[K-BL, K-BL]is K-BL's VLAN 1314 client sending to K-BL's zone client in VLAN 4003 (10.9.90.106): same TRex port and S-VLAN, different C-VLAN, and the Enterprise firewall in between. The zone client is always the one at the Border Leaf AP of the source's data centre (at C-BL: 10.9.90.113). With firewall-zone option A,l3-entfwanddscp-entfwwould usedst_vlan: 1420and the APFWas the second element of every pair. - One stream per TOS value and direction. 0x00 is the best-effort reference that differs from the marked copies (EF,
AF41, CS1) only in the TOS byte;
class: DSCPis the tag value,paththe forwarding rule (L2 or L3-ENTFW).
Expansion rules. Every pair × VLAN (or VLAN pair) × TOS value gives one stream; bidir: true adds the reverse
stream; pairs_from re-uses the pairs of other groups; a group without its own value takes it from defaults. Class L2
requires both APs to carry the VLAN and sends to the remote client's MAC; the L3 classes require a gateway for the
source VLAN and send to the resolved gateway MAC; path tells a DSCP group which of the two rules applies. The plan's
sketch of this file writes class: L2 or class: L3 - the forwarding rule - and derives the class tag (L2, L3-BL,
L3-DCFW, L3-ENTFW or DSCP) from the group; this course writes the tag value directly and adds path to the DSCP groups,
which yields the same streams and the same tags.
The DSCP groups always contain the BE value 0x00: it is the reference that differs from the marked copies only in the TOS
byte. The profile above expands to 74 latency streams (10 + 12 + 12 + 8 + 8 + 8 + 8 + 8, about 10 400 pps) and 102
flow-stat streams (34 + 68, about 10 200 pps) - the budget of Chapter 16. The validator refuses
a profile above the guard rails (120 latency streams, 600 flow-stat streams, 50 kpps, 50 Mbit/s, 100 pps per stream
through a firewall) unless --force is given, and never accepts more than the hard TRex limits of 128 and 1023.
From profile to streams: the generation algorithm
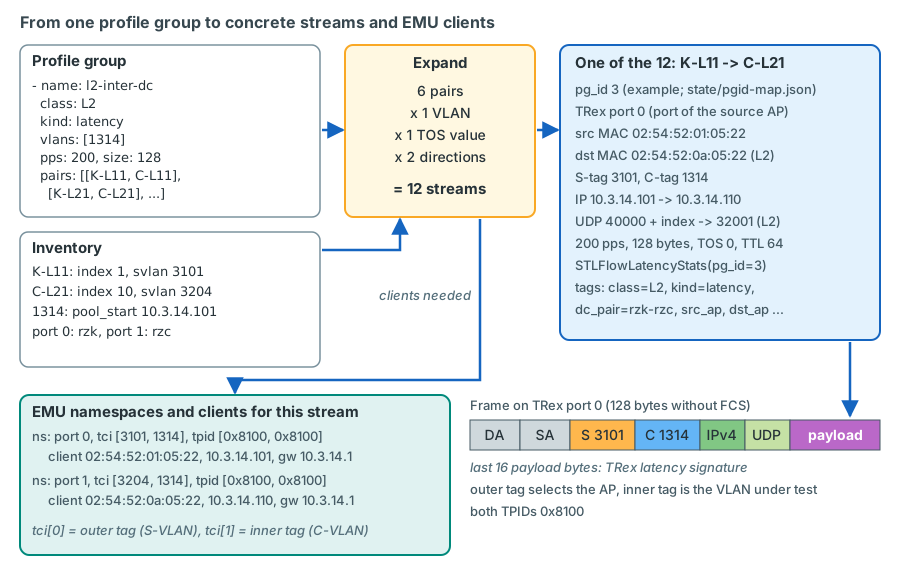
- Load and validate inventory and profile (JSON schema plus the semantic rules), compute the stream list, check the
budget per kind. Nothing has been sent to TRex yet - this is what
trexctl planshows. - Allocate pg_ids. The key of a stream is
class|kind|src_ap|src_vlan|dst_ap|dst_vlan|tos. If the key exists in/data/trexctl/state/pgid-map.json, its pg_id is reused; otherwise the lowest free number of the kind's range is taken and persisted. The ranges are part of the plan: latency streams 1-127, loss-only (flow-stat) streams 1000-1999, trex-lab 2000 and above. A stream that disappears from the profile keeps its entry, so re-adding it later restores its Grafana history. - Provision EMU on trex-mon (next section) and collect the resolved gateway MACs.
- Build packets:
Ether(src=client MAC, dst=remote client MAC or gateway MAC) / Dot1Q(S-VLAN) / Dot1Q(C-VLAN) /
   IP(src, dst, tos, ttl=64) / UDP(sport=40000 + stream index, dport=32000 + class) / payload
, padded to the frame size without FCS. Latency streams get UDP checksum 0 (chksum=0, legal for IPv4): TRex writes the signature into every packet without recalculating the checksum, and a firewall that verifies UDP checksums would otherwise drop them confirm on the bench. Because both MACs are set explicitly in the packet, TRex transmits them unchanged instead of using the port's own MAC; it only sets bit 0 of the TOS byte (0xB8 leaves as 0xB9). Pinned lab ports omit the outer tag. - Create the streams:
STLStream(packet=STLPktBuilder(pkt), mode=STLTXCont(pps), flow_stats=STLFlowLatencyStats(pg_id)
   or STLFlowStats(pg_id))
, grouped by TRex port: every stream leaves through the port that carries its source AP (port 0 for the RZK attachment points, port 1 for the RZC ones - so the zone client at K-BL sends from port 0 and the one at C-BL from port 1), so that each client MAC is only ever seen behind one TRex port. Each group becomes a dynamic profile of its own on that port (<port>.<group>, TREX-STL "Dynamic multiple profiles"):add_streams()andstart()per profile, so that one group can later be stopped, rebuilt or replaced while all others keep running. - Track the gateway MAC of every VLAN marked
gateway_mac_trackingand rebuild the affected streams when it changes - the gateway-MAC tracker, described in the next section. - Record the applied stream table (
/data/trexctl/state/applied-<profile>.json): pg_id, kind, ports, addresses and all tags. The exporter reads it to tag the statistics. Then release the ports without stopping the traffic:disconnect(stop_traffic=False, release_ports=True). The streams keep running on the server without an owner; a laterapplyorupdatere-acquires the ports withforce=True. (The defaultdisconnect()would stop every stream the client owns - see The data pipeline end to end.)
Why one TRex port per attachment point?
Both monitoring ports are trunks that carry every S-VLAN, so any AP could be reached from either. But the TX switch learns a client MAC on the port it last came from. If the same client sent from port 0 and port 1, its MAC would move between the two trunk ports and return traffic would go to the wrong one - TRex would count loss and the TX switch would report MAC moves. Binding each AP's clients and streams to one port avoids that by construction.
EMU provisioning
trexctl derives the EMU profile from the stream list: every (AP, VLAN) that appears as a source or a destination needs one client. The namespace key is the TRex port plus the two VLAN tags as they appear on that port's trunk:
EMUNamespaceKey(vport=<TRex port>, tci=[<S-VLAN>, <C-VLAN>], tpid=[0x8100, 0x8100])-tci[0]andtpid[0]are the outer tag, the first tag after the MAC header;- one
EMUClientObj(mac=..., ipv4=..., ipv4_dg=<gateway of the VLAN>)per client, pluginsarp(enabled) andicmp; EMUProfile(ns=[...]), loaded withemu.load_profile(profile, max_rate)- but only when EMU is empty: at the first apply and after a TRex restart. Loading replaces the whole EMU profile: the client first removes all existing namespaces and clients (remove_profile), and the console commandemu_load_profiledoes the same.
Changes are incremental. A full reload while monitoring runs would briefly remove every emulated host: for that moment
no TRex client answers ARP, and every gateway resolution starts again. trexctl therefore compares the wanted clients with
get_all_ns_and_clients() and changes only the difference: add_ns() and add_clients(ns_key, clients) for a new AP or
VLAN, remove_clients([EMUClientKey(ns_key, mac), ...], max_rate) and remove_ns() for obsolete ones. All other clients
keep running untouched.
Before loading, the TRex ports are prepared so that EMU receives what it needs: promiscuous and multicast on
(set_port_attr(ports, promiscuous=True, multicast=True)), and filtered service mode
(set_service_mode(ports, enabled=False, filtered=True, mask=...)). In filtered mode the RX core forwards only the
packet types selected by the mask to EMU, while the latency and flow-stat packets continue to be counted. The mask
constants live in trex.common.trex_client: NO_TCP_UDP_MASK (1) selects everything that is neither TCP nor UDP - ARP
and ICMP - which is all the monitoring clients need. The console command service --emu uses the wider combination
DHCP_MASK | MDNS_MASK | NO_TCP_UDP_MASK | TRANSPORT_MASK.
confirm on the bench that latency and flow-stat UDP is still counted with the
chosen mask.
After loading, trexctl polls emu.get_all_ns_and_clients() until every client that needs a gateway reports
dgw.resolve = True, and reads the gateway MAC from dgw.rmac. Gateway resolution is shared per namespace: all clients
of VLAN 1314 behind K-L11 use one ARP entry for 10.3.14.1. Clients that do not resolve within three attempts are reported,
and only their streams are left out - one firewall interface that does not answer ARP must not stop the whole profile.
The gateway-MAC tracker
TRex writes the gateway MAC into a routed stream's packet once, when the stream is built; nothing in TRex updates it
later. That matters wherever the gateway is a firewall cluster that answers with member MACs, as both firewall clusters
did in February 2025 (Chapter 15): after a failover the active member - and with it the gateway
MAC - changes. The inventory therefore marks every VLAN whose gateway is a firewall cluster with
gateway_mac_tracking: true: the zone VLAN 4003 (1420 with option A) and the production VLANs behind the DC-FW, and
trexctl inventory validate enforces the flag. For these VLANs trexctl runs a tracker:
- Every 10 s it reads the EMU client information of the tracked clients (
dgw.rmac); every 60 s it additionally forces a re-resolution of their gateways. - When the resolved MAC differs from the MAC baked into the running streams, it rebuilds the affected streams: all L3 streams sourced in that VLAN at that AP. In the default profile these are both directions of L3-DCFW, the reverse L3-ENTFW streams and the reverse DSCP copies from the zone clients. Rebuilding means removing and re-adding them with the new MAC and the same pg_ids; their counters restart and the exporter takes a new baseline.
- It writes a
trex_eventpoint of kindgateway_mac_changed- an annotation on the dashboards and the informational alert Gateway MAC changed (Chapter 19).
Until the rebuild, the affected streams lose packets: the gap measured on the firewall classes includes the detection time. And the tracker can only see what EMU has learned. EMU's ARP plugin learns a new gateway MAC in three different ways (Chapter 6):
- an incoming ARP request from the gateway - including a gratuitous request - updates the entry at once;
- an ARP reply sent to the Ethernet broadcast address is dropped (counter
pktRxErrNoBroadcast); - otherwise the new MAC arrives with the client's next periodic query, every
timerseconds - 60 s by default.
Recovery within 15 s is still to be confirmed
The plan's acceptance target is recovery within 15 s of a firewall failover, or at once with a ClusterXL virtual
MAC. If ClusterXL announces the new member with gratuitous ARP requests, EMU learns the MAC immediately and the
tracker sees it at its next poll, at most 10 s later. If ClusterXL announces it with broadcast replies, or not at
all, EMU waits for its next periodic query - up to 60 s with the default timer, too slow for the target. Two
remedies close the gap: a shorter ARP timer for the clients of the tracked VLANs (client plugin data
'arp': {'timer': 10} instead of the default 60), and a forced query as soon as firewall-class streams lose
packets - in the API EMUClient.arp.cmd_query(c_key, garp=False), on the console emu_arp_cmd_query with the
client's namespace (-p, --vlan, --tpid), --mac and --garp off. A ClusterXL virtual MAC removes the problem
entirely (plan open item 12). confirm on device in the planned failover test: how
ClusterXL announces the new MAC, and which recovery time is actually reached.
With native TRex the tracker is a manual check: emu_show_all (or emu_show_client_info for one client) on the trex-mon
console shows each client's resolved gateway MAC, emu_arp_cmd_query forces a new query, and the affected streams are
removed and re-added with the new MAC. The failover scenario of Chapter 23 walks
through it.
The command line (planned)
| Command | What it will do |
|---|---|
trexctl inventory validate |
Schema and semantic checks; prints the AP / VLAN / IP / MAC table |
trexctl inventory render-leaf --ap K-L11 |
Prints the Comware configuration for the AP port of the Leaf (Chapter 13) |
trexctl inventory render-tx --switch sw-rzk-TX1 |
Prints the QinQ port configuration of a TX switch (Chapter 12) |
trexctl plan -p monitoring-default |
Expands the profile: every stream with pg_id, port, addresses, rate; budget summary. Changes nothing |
trexctl apply -p monitoring-default [--force] |
Provisions EMU, builds and starts the streams, records the applied stream table and releases the ports without stopping the traffic (disconnect(stop_traffic=False, release_ports=True)); the next apply or update re-acquires them with force=True. A re-apply changes only the difference: EMU clients are added or removed one by one, changed groups are rebuilt, unchanged groups keep running |
trexctl status [--watch] |
Per stream TX/RX pps, loss, latency average/max/jitter; port and global counters; unresolved clients |
trexctl update --group l2-inter-dc --pps 1000 |
Changes the rate of a group, for example before a maintenance window. Latency streams ignore the multiplier, so their group is removed and re-added with the new rate (same pg_ids, counters restart) |
trexctl stop [-p profile \| --all] |
Stops streams; EMU clients stay |
trexctl emu show \| resolve \| clear |
EMU client table with the resolved gateway MACs; forced re-resolution of the gateways; removal of clients - always incremental, never a reload of the whole EMU profile while streams run |
trexctl exporter run |
The exporter in the foreground (normally run by systemd) |
trexctl test throughput --src K-L11 --dst C-L21 --vlan 1314 --sizes 64,512,1518 --duration 60 |
Lab: binary search for the no-drop rate per frame size, with report |
trexctl test soak --src K-L11 --dst FWZ --src-vlan 1314 --dst-vlan 4003 --rate 2gbps --duration 900 |
Lab: fixed load from K-L11 through the Enterprise firewall into the zone (FWZ = the zone alias of the inventory) for 15 minutes; loss and latency over time |
trexctl test convergence --group l2-inter-dc --pps 1000 --duration 1800 |
Monitoring instance: temporarily raises the rate of a group (1 ms resolution at 1000 pps) and records the outage duration per stream. The loss-only groups are split by VLAN, so a pair set such as the inter-DC pairs is raised through its latency group |
trexctl test astf --profile lab-fw-http.yaml --mult 500 --duration 300 |
Lab: writes trex_lab_astf.yaml for the pinned ports, starts trex-lab-astf, reports flows, connections per second and goodput |
trexctl annotate "<text>" |
Writes a trex_event point of kind annotation (a Grafana annotation) |
trexctl report --test <id> --format md\|json\|html |
Renders a stored test report |
The lab test runners are explained step by step in Chapter 22.
trexctl status must agree with the TRex console: per-stream counters with stats -s, latency with stats -l. The
console shows only the first 4 (stats -s) or 5 (stats -l) pg_ids, so it is a spot check, not a full view.
The data pipeline end to end
The animation follows one number from the TRex server to an alert e-mail. Watch three things: the exporter does not pass TRex values through but computes per-interval values from cumulative counters; the tags travel with every point and are what Grafana later groups by; and the alert rule evaluates what is in InfluxDB, so a stalled exporter must raise its own alert.
| Stage | Where | What happens |
|---|---|---|
| Counters | trex-mon RX core and data-plane threads | Per pg_id: cumulative TX/RX packets; for latency streams also the latency statistics and the cumulative histogram |
| Poll | exporter, every 2 s | One get_pgid_stats(pg_ids) call (up to 1024 pg_ids per call) and one get_stats() for ports and global values |
| Compute | exporter | Rates, confirmed loss, per-interval latency maximum and histogram, restart handling |
| Line protocol | exporter | One point per stream and interval, with tags from the applied stream table |
| Write | exporter → InfluxDB | HTTP write to bucket trex with a write-only token; buffered while InfluxDB is unavailable |
| Store | InfluxDB | Raw 2 s points for 90 days; a Flux task writes 1-minute aggregates to trex_longterm (730 days) |
| Query | Grafana | Flux queries filtered and grouped by tags (class, DC pair, AP, VLAN, kind) |
| Alert | Grafana unified alerting | Rules on loss, path down, latency, exporter silence and changed gateway MACs; notifications to the network team |
Polling every two seconds
Two seconds is the compromise of the design: fine enough to see a short outage as a distinct event, coarse enough to keep InfluxDB small (about 176 streams × 0.5 points/s). The exporter uses a monotonic clock to measure the real time between two polls - a poll can be late - and computes rates from that, not from the nominal 2 s. The point timestamp is the wall clock (NTP) at the poll.
The exporter only reads. Statistics are readable by every connected client, so the exporter connects to trex-mon
without acquiring any port and never calls acquire(), reset() or a traffic command. When it shuts down it
disconnects with disconnect(stop_traffic=False): the default disconnect() stops the traffic on every port the client
owns - harmless for a client that owns nothing, but an exporter that once acquired a port by mistake would take the
monitoring down with it. Ownership is taken only by trexctl apply for the duration of the change: it ends with
disconnect(stop_traffic=False, release_ports=True), so between two applies the monitoring streams run on the server
without an owner, and the next apply or update re-acquires the ports with force=True.
sketch - validate on the bench
from trex.stl.api import STLClient

c = STLClient(server="127.0.0.1", sync_port=4501, async_port=4500)   # trex-mon
c.connect()                                   # no acquire(): the exporter never owns a port
try:
    stats = c.get_pgid_stats(pg_ids)          # pg_ids from the applied stream table, at most 1024 per call
finally:
    c.disconnect(stop_traffic=False)          # never stop the monitoring traffic
Never call clear_stats() or reset() while streams are being polled
In the Python client, clear_stats() does not clear the TRex server; it stores the current values as a reference and
returns later values relative to it. For latency streams it also sets the reference total_max to zero and from
then on computes the maximum itself - from the last_max values it happens to see at each poll. After a
clear_stats() (which reset() includes), the "lifetime maximum" therefore misses every peak between polls. The
exporter works on the absolute server counters and computes its own deltas. A reset() before the streams are
created, as in the runner below, is harmless: the new streams get new version numbers and are counted from zero.
Per-interval deltas and packets in flight
Loss is TX minus RX, but not at every instant: at the moment of a poll some packets have been sent and not yet received,
and the TX and RX counters are not read at exactly the same instant. A naive drop = ΔTX − ΔRX per interval reports a
"lost" packet at one poll and a negative loss at the next. Real loss behaves differently: it never comes back. The planned
exporter uses that difference:
- Keep the deficit
D = TX − RXof every stream at every poll. - The settled deficit is the smaller of the current and the previous deficit: a packet that was in flight at one poll has arrived by the next one, two seconds later.
- The exporter remembers how much loss it has already reported and writes only the increase:
drop_pkts = max(0, settled − reported);drop_pkts_totalis the running sum.
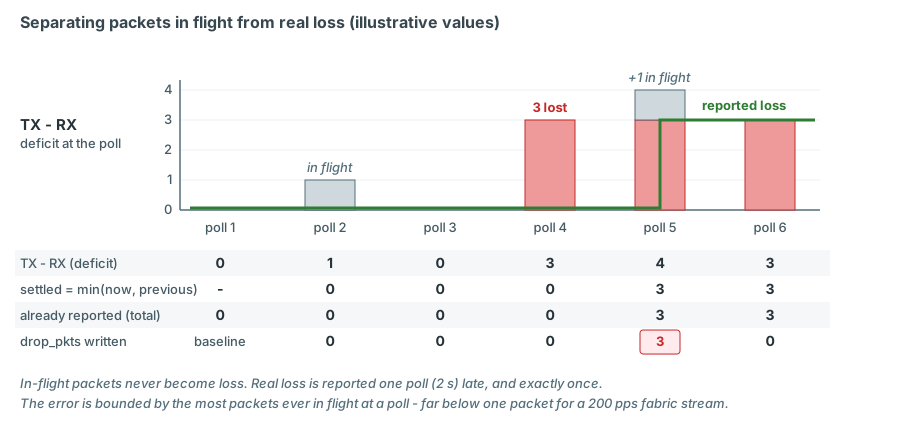
The price is a delay of one poll for loss and a bounded error: the error never exceeds the largest number of packets that
were ever in flight at a poll - well below one packet for a 200 pps stream with fabric latency. Path down is detected
without that delay: rx_pps = 0 while tx_pps > 0. Latency streams provide a second, independent view: TRex's sequence counters
(err_cntrs: dropped, out_of_order, dup, seq_too_high, seq_too_low) are based on sequence numbers and are
immune to packets in flight; but they move only when packets arrive again, so they report an outage after it ended. When
a test stops streams, the same idea is built into TRex itself: stop() and wait_on_traffic() wait rx_delay_ms
(default 10 ms on physical ports) before removing the RX filters, so late packets are still counted.
Restarts and re-created streams
Counters start again from zero when a stream is re-created or TRex restarts. Without care, the exporter would compute huge negative deltas and nonsense loss values. Three signals cover the cases:
ver_id.get_pgid_stats()returns a version number per pg_id. The Python client itself discards its saved reference for a pg_id whose version changes - the pg_id now belongs to a newly added stream whose counters started again. This is also what happens when trexctl rebuilds a stream on purpose: a rate change of a latency group or a new gateway MAC after a failover.- Counters going backwards (TX or RX smaller than at the previous poll) - a TRex restart.
- RPC errors. If trex-mon is gone, every call raises
TRexError; the exporter reconnects. Its supervisor thread recognises a trex-mon restart by two signals - the server uptime has reset, oractive_streamshas fallen to zero while a profile is recorded as active in/data/trexctl/state/- and runstrexctl apply -p <active profile>once the server accepts connections again. The same thread restarts the gateway-MAC tracker.
In each case the exporter takes a new baseline: it stores the current counters and writes no rates, loss or latency for that one interval. The cost is one missing point per stream; the benefit is that a TRex restart never shows up as loss on the dashboards.
Latency per interval: why not just last_max and average?
TRex updates the latency statistics of every stream in 0.5-second windows. What the API returns at a poll is defined
by those windows (TRex STL API, get_pgid_stats):
| Value | Meaning | Problem for a 2 s poll |
|---|---|---|
average |
Low-pass filtered: at every window, new = previous / 2 + window average / 2 | Not the average of the interval, but 15/16 of its weight lies in the last four windows - usable as "current average" |
last_max |
Maximum of the last 0.5 s window | Sees one window of four: a spike in an earlier window is invisible |
total_max, total_min |
Extremes over the stream lifetime | total_max changes only when a new record is set |
jitter |
RFC 3550 A.8 smoothed jitter | Fine as is |
histogram |
Cumulative packet counts per bucket since the stream started | Nothing - this is the key |
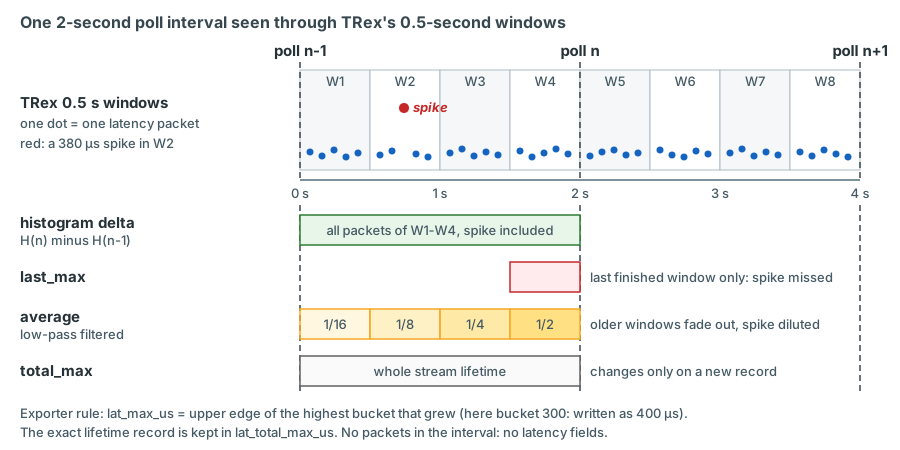
The histogram buckets are logarithmic. The key is the lower edge in microseconds: 10, 20, ... 90 (10 µs wide), 100, 200, ... 900 (100 µs wide), 1000, 2000, ... (1 ms wide), and so on up to one second; key 0 counts samples below 10 µs. Because the counts are cumulative, the difference between two polls is the histogram of the interval. The exporter derives the interval maximum from it with one fixed rule:
lat_max_us= the upper edge of the highest bucket that grew in the interval.
The value is conservative and has the bucket's resolution - 10 µs below 100 µs, 100 µs up to 1 ms, 1 ms above - and it
never misses a peak, whichever window the peak fell into: the 380 µs spike of the figure lands in bucket 300 and is
written as 400 µs. Grafana reads it the same way: "400" means "the worst packet of the interval was below 400 µs"
(Chapter 19). The exact lifetime record is written separately as lat_total_max_us (TRex
total_max), and TRex's last_max as lat_last_max_us - for reference only: it covers the last 0.5-s window, never
the whole interval, so no panel or rule uses it as the interval maximum.
Two details matter on the dashboards. First, the histogram counts a packet as soon as it arrives, whereas total_max and
last_max follow only at the next window change - a peak in the window still open at the poll appears in lat_max_us
of this interval but in lat_total_max_us only one poll later. Second, when no packet arrives, TRex does not update
the window at all - average and last_max keep their last values. The exporter therefore writes latency fields only
for intervals in which the stream received packets; during an outage the latency panel shows a gap, not a flat line
that looks healthy.
Exact percentiles: the HDR histogram option
The TRex server also accepts --hdrh ("report latency using high dynamic range histograms"); the latency statistics
then contain an encoded HDR histogram per stream. It would allow exact percentiles per interval, at the cost of more
CPU and a decoder in the exporter. It is not part of the baseline design; evaluate it on the bench if the bucket
resolution proves too coarse.
Building line protocol and writing it
Every interval and stream becomes one point of measurement trex_stream. The tags come from the applied stream table,
the fields from the computation above. One line, with illustrative values:
trex_stream,pg_id=3,name=pg3,kind=latency,class=L2,src_ap=K-L11,dst_ap=C-L21,src_dc=rzk,dst_dc=rzc,dc_pair=rzk-rzc,src_vlan=1314,dst_vlan=1314,tos=0,instance=mon,profile=monitoring-default tx_pkts=86400i,rx_pkts=86400i,drop_pkts=0i,drop_pkts_total=0i,tx_pps=200.0,rx_pps=200.0,tx_bps=211200.0,rx_bps=211200.0,rx_ok=true,lat_avg_us=142.6,lat_min_us=131.0,lat_max_us=200.0,lat_last_max_us=157.0,lat_total_max_us=388.0,jitter_us=1.9,hist_100=400i,seq_dropped=0i,seq_ooo=0i,seq_dup=0i 1791878402
illustrative values All 400 packets of the interval fell into bucket 100 (100-199 µs),
so lat_max_us is its upper edge, 200. lat_last_max_us (157) is only the largest value of the last 0.5-s window.
Three rules keep the writes clean:
- Stable field types. InfluxDB rejects a point whose field has a different type than the same field already stored
for that series (HTTP 422, "partial write"). The exporter casts every value explicitly: counters as integers (suffix
iin line protocol), rates and latencies as floats - even when TRex returns44instead of44.0- andrx_okas a boolean. - A scoped token. The exporter's token can only write to bucket
trex:influx auth create --org lvr --description "trex exporter (write trex)" --write-bucket <bucket-id>(bucket ID frominflux bucket list). It lives in/etc/trexctl/secrets.env(mode 0600) and reaches the process through systemd'sEnvironmentFile=. InfluxDB OSS 2.9 stores tokens hashed: the value is shown once at creation - keep it in the password safe. - Buffer only what can succeed later. On connection errors, 5xx and 503 ("service unavailable") the exporter keeps the points in a bounded in-memory buffer (about ten minutes) and sends them with the next poll; when the buffer is full, the oldest points go first. On 400, 401, 404 or 422 retrying cannot help - the batch is logged and dropped. Re-sending a point is harmless: a point with the same measurement, tag set and timestamp overwrites the earlier one.
From InfluxDB to Grafana and alerts
InfluxDB keeps the raw 2-second points in bucket trex for 90 days; a Flux task aggregates them every 10 minutes into
1-minute values in trex_longterm (mean of averages and rates, maximum of maxima, sum of drops and histogram buckets),
kept for 730 days (Chapter 8). Grafana reads both through Flux data sources with a read-only
token and evaluates the alert rules: loss per stream over 30 s, path down (rx_pps = 0 while tx_pps > 0), latency above
the baseline, an informational rule on gateway_mac_changed events, and no new points - the exporter-down rule,
without which a dead exporter would look like a perfectly quiet network. Remember the one-poll delay of drop_pkts
when choosing pending periods. The dashboards and the rules are the subject of Chapter 19.
The InfluxDB data model
| Measurement | Tags | Fields |
|---|---|---|
trex_stream |
pg_id, name, kind (latency / flowstat), class, src_ap, dst_ap, src_dc, dst_dc, dc_pair (rzk-rzk, rzk-rzc, rzc-rzc, or x-fw for streams to or from the firewall zone, VLAN 4003), src_vlan, dst_vlan, vrf, tos, dscp, instance, profile (+ profile tags) |
see the next table |
trex_port |
instance, port, role |
tx_pps, rx_pps, tx_bps, rx_bps, ierrors, oerrors, tx_queue_full, link_up |
trex_global |
instance |
cpu_util, rx_cpu_util, bw_per_core, rx_drop_bps, queue_full, plus exporter values active_streams, unresolved_clients, exporter_lag_ms |
trex_test |
test_id, type, src_ap, dst_ap, vlan, size |
offered_bps, offered_pps, rx_bps, loss_pct, lat_avg_us, lat_max_us, ndr_bps |
trex_event |
kind (annotation, apply, stop, test, gateway_mac_changed) |
text |
Fields of trex_stream per stream kind:
| Field | Type | latency | flowstat | Meaning |
|---|---|---|---|---|
tx_pkts, rx_pkts |
integer | ✓ | ✓ | TRex counters since the stream started |
drop_pkts |
integer | ✓ | ✓ | Newly confirmed loss in this interval (one-poll delay) |
drop_pkts_total |
integer | ✓ | ✓ | Confirmed loss since the last baseline |
tx_pps, rx_pps |
float | ✓ | ✓ | Packet rates over the measured interval |
tx_bps, rx_bps |
float | ✓ | ✓ | Bit rates over the measured interval |
rx_ok |
boolean | ✓ | ✓ | Summary flag of the interval for state panels; its exact rule (for example "packets received and no new loss") is fixed with the exporter implementation |
lat_avg_us |
float | ✓ | - | TRex low-pass average at the poll |
lat_min_us, lat_total_max_us |
float | ✓ | - | Lifetime minimum and maximum (exact TRex values) |
lat_max_us |
float | ✓ | - | Maximum within the interval: upper edge of the highest histogram bucket that grew (bucket resolution) |
lat_last_max_us |
float | ✓ | - | TRex last_max: maximum of the last 0.5-s server window only - kept for reference, never used as the interval maximum |
jitter_us |
float | ✓ | - | RFC 3550 jitter |
seq_dropped, seq_ooo, seq_dup |
integer | ✓ | - | TRex sequence-error counters (cumulative; seq_dropped can decrease when late packets arrive) |
hist_<lower edge> |
integer | ✓ | - | Packets per latency bucket in this interval (delta of the cumulative TRex histogram), e.g. hist_100 = 100-199 µs; only non-empty buckets |
A flow-stat stream has no latency fields at all, so every latency panel and rule filters on kind == "latency". A
latency stream has none for an interval in which it received no packets. Cardinality is no concern: about 176 series in
trex_stream, each with at most a few dozen fields.
Native TRex today: a minimal runner and exporter
Until trexctl exists, the following runner does the essential work for a handful of streams: it prepares the trex-mon
ports, loads an EMU profile for three attachment points, starts double-tagged latency and flow-stat streams, and exports
their statistics every two seconds with the loss, restart and latency rules of this chapter. It deliberately leaves out
the inventory, pg_id persistence, budget checks, the gateway-MAC tracker, the bit-rate fields and rx_ok, and the
port/global statistics - it is a bench tool and a reference for the real implementation. Unlike the trexctl exporter it
is the owner of the ports: it applies the streams itself, so it acquires the ports (through reset()) and loads the
complete EMU profile once at start-up, when nothing else runs. A separate exporter would connect read-only, as shown
above.
sketch - validate on the bench All TRex and influxdb-client calls are taken from the TRex v3.08 client and the influxdb-client 1.50 library.
"""Minimal monitoring runner and exporter for trex-mon (bench sketch).

Loads EMU clients for three attachment points, starts double-tagged latency and
flow-stat streams, polls their statistics every 2 s and writes them to InfluxDB.
"""
import logging
import math
import os
import sys
import time
from collections import deque
from dataclasses import dataclass, field

from trex.stl.api import (STLClient, STLStream, STLPktBuilder, STLTXCont,
                          STLFlowStats, STLFlowLatencyStats, TRexError)
from trex.common.trex_client import NO_TCP_UDP_MASK
from trex.emu.api import (EMUClient, EMUNamespaceKey, EMUNamespaceObj,
                          EMUClientObj, EMUProfile, Mac, Ipv4)
from scapy.layers.l2 import Ether, Dot1Q           # TRex's own Scapy (import trex first)
from scapy.layers.inet import IP, UDP
from influxdb_client import InfluxDBClient, Point, WritePrecision
from influxdb_client.client.write_api import SYNCHRONOUS
from influxdb_client.rest import ApiException

log = logging.getLogger("mini_monitor")

TREX = dict(server="127.0.0.1", sync_port=4501, async_port=4500)   # trex-mon
EMU_PORT = 4510
INFLUX_URL, INFLUX_ORG, INFLUX_BUCKET = "http://127.0.0.1:8086", "lvr", "trex"
INTERVAL = 2.0                                      # seconds between polls
BACKLOG_POINTS = 60_000                             # roughly 10 minutes of points
PERMANENT = {400, 401, 403, 404, 413, 422}          # HTTP codes a retry cannot fix

# attachment point -> (AP index, TRex port, S-VLAN, data centre)
APS = {"K-L11": (1, 0, 3101, "rzk"),
       "K-BL":  (6, 0, 3110, "rzk"),
       "C-L21": (10, 1, 3204, "rzc")}
# VLAN under test -> (first pool address, gateway)
VLANS = {1314: ("10.3.14.101", "10.3.14.1"),
         1315: ("10.3.15.101", "10.3.15.1")}
DPORT = {"L2": 32001, "L3-BL": 32002}               # UDP destination port per class


@dataclass
class StreamDef:
    pg_id: int
    kind: str                                       # "latency" or "flowstat"
    cls: str                                        # traffic class
    src_ap: str
    src_vlan: int
    dst_ap: str
    dst_vlan: int
    pps: int = 200
    size: int = 128                                 # bytes without FCS


STREAMS = [
    StreamDef(1, "latency", "L2", "K-L11", 1314, "K-BL", 1314),
    StreamDef(2, "latency", "L2", "K-BL", 1314, "K-L11", 1314),
    StreamDef(3, "latency", "L2", "K-L11", 1314, "C-L21", 1314),
    StreamDef(4, "latency", "L2", "C-L21", 1314, "K-L11", 1314),
    StreamDef(5, "latency", "L3-BL", "K-L11", 1314, "K-BL", 1315),
    StreamDef(6, "latency", "L3-BL", "K-BL", 1315, "K-L11", 1314),
    StreamDef(1000, "flowstat", "L2", "K-L11", 1315, "K-BL", 1315, pps=100),
    StreamDef(1001, "flowstat", "L2", "K-BL", 1315, "K-L11", 1315, pps=100),
]


def client_mac(ap, vlan):                           # 02:54:52:<AP index>:<VLAN high>:<VLAN low>
    return "02:54:52:%02x:%02x:%02x" % (APS[ap][0], vlan >> 8, vlan & 0xFF)


def client_ip(ap, vlan):                            # pool start + (AP index - 1)
    a, b, c, d = (int(x) for x in VLANS[vlan][0].split("."))
    return "%d.%d.%d.%d" % (a, b, c, d + APS[ap][0] - 1)


def dc_pair(src_ap, dst_ap):                        # rzk-rzk, rzk-rzc or rzc-rzc (no firewall streams here)
    a, b = APS[src_ap][3], APS[dst_ap][3]
    return "rzk-rzc" if {a, b} == {"rzk", "rzc"} else "%s-%s" % (a, b)


# ------------------------------------------------------------------ EMU clients
def needed_clients():
    return sorted({(s.src_ap, s.src_vlan) for s in STREAMS} |
                  {(s.dst_ap, s.dst_vlan) for s in STREAMS})


def build_emu_profile():
    namespaces = {}
    for ap, vlan in needed_clients():
        _, port, svlan, _ = APS[ap]
        if (port, svlan, vlan) not in namespaces:   # tci[0] = outer tag (S-VLAN), tci[1] = inner (C-VLAN)
            key = EMUNamespaceKey(vport=port, tci=[svlan, vlan], tpid=[0x8100, 0x8100])
            namespaces[(port, svlan, vlan)] = EMUNamespaceObj(
                ns_key=key, def_c_plugs={"arp": {"enable": True}, "icmp": {}})
        namespaces[(port, svlan, vlan)].add_clients(EMUClientObj(
            mac=Mac(client_mac(ap, vlan)).V(),
            ipv4=Ipv4(client_ip(ap, vlan)).V(),
            ipv4_dg=Ipv4(VLANS[vlan][1]).V()))
    return EMUProfile(ns=list(namespaces.values()),
                      def_ns_plugs={"arp": {"enable": True}, "icmp": {}})


def wait_for_gateways(emu, timeout=60):
    """Return {client MAC: gateway MAC} for all clients whose gateway is resolved."""
    wanted = {client_mac(ap, vlan) for ap, vlan in needed_clients()}
    deadline = time.monotonic() + timeout
    while True:
        resolved = {}
        for ns in emu.get_all_ns_and_clients():
            for c in ns["clients"]:
                dgw = c.get("dgw") or {}
                if dgw.get("resolve"):
                    resolved[c["mac"].lower()] = dgw["rmac"].lower()
        if wanted <= resolved.keys() or time.monotonic() > deadline:
            for mac in sorted(wanted - resolved.keys()):
                log.warning("gateway not resolved for client %s", mac)
            return resolved
        time.sleep(2)


# ------------------------------------------------------------------ streams
def build_stream(s, index, gw_mac):
    src_mac = client_mac(s.src_ap, s.src_vlan)
    dst_mac = client_mac(s.dst_ap, s.dst_vlan) if s.cls == "L2" else gw_mac[src_mac]
    pkt = (Ether(src=src_mac, dst=dst_mac)          # explicit MACs are sent unchanged
           / Dot1Q(vlan=APS[s.src_ap][2])           # outer tag: S-VLAN of the source AP
           / Dot1Q(vlan=s.src_vlan)                 # inner tag: the production VLAN
           / IP(src=client_ip(s.src_ap, s.src_vlan), dst=client_ip(s.dst_ap, s.dst_vlan), ttl=64)
           / UDP(sport=40000 + index, dport=DPORT[s.cls],
                 chksum=0 if s.kind == "latency" else None))   # latency: per-packet signature, checksum 0
    pad = max(0, s.size - len(pkt)) * b"\x00"       # latency streams need >= 16 payload bytes
    stats = (STLFlowLatencyStats(pg_id=s.pg_id) if s.kind == "latency"
             else STLFlowStats(pg_id=s.pg_id))
    return STLStream(name="pg%d" % s.pg_id, packet=STLPktBuilder(pkt=pkt / pad),
                     mode=STLTXCont(pps=s.pps), flow_stats=stats)


def apply(c, emu):
    ports = sorted({port for _, port, _, _ in APS.values()})
    c.reset(ports=ports)                            # force-acquire, stop, remove streams; also turns
    c.set_port_attr(ports=ports, promiscuous=True, multicast=True)    # promiscuous and service mode off
    c.set_service_mode(ports=ports, enabled=False, filtered=True, mask=NO_TCP_UDP_MASK)  # ARP/ICMP to EMU
    emu.load_profile(profile=build_emu_profile(), max_rate=100)       # full load: start-up only (removes all clients)
    gw_mac = wait_for_gateways(emu)
    by_port, started = {}, []
    for index, s in enumerate(STREAMS):
        if s.cls != "L2" and client_mac(s.src_ap, s.src_vlan) not in gw_mac:
            log.warning("pg_id %d not started: gateway unresolved", s.pg_id)
            continue
        by_port.setdefault(APS[s.src_ap][1], []).append(build_stream(s, index, gw_mac))
        started.append(s.pg_id)
    for port, streams in by_port.items():
        c.add_streams(streams, ports=[port])
    c.start(ports=list(by_port), force=True)
    log.info("started %d streams", len(started))
    return started


# ------------------------------------------------------------------ statistics
@dataclass
class State:                                        # per pg_id, carried from poll to poll
    ver: object
    tx: int
    rx: int
    deficit: int
    reported: int                                   # loss already written (high-water mark)
    hist: dict = field(default_factory=dict)        # cumulative histogram at the previous poll


def bucket_upper(key):                              # buckets: 0, 10-90, 100-900, 1000-9000 ... usec
    return 10 if key < 10 else key + 10 ** (len(str(int(key))) - 1)


def usable(value):                                  # TRex reports a huge minimum before the first sample
    return math.isfinite(value) and value < 1e7


def interval_max(lat, prev):
    """lat_max_us: upper edge of the highest histogram bucket that grew in the interval (usec), or None."""
    grown = [k for k, v in lat["histogram"].items() if v > prev.hist.get(k, 0)]
    return float(bucket_upper(max(grown))) if grown else None


def stream_point(s, st, prev, dt, ts):
    pg = s.pg_id
    fs = st["flow_stats"].get(pg)
    if fs is None:
        return None                                 # TRex does not know the stream (yet)
    tx, rx = int(fs["tx_pkts"]["total"]), int(fs["rx_pkts"]["total"])
    lat = st["latency"][pg]["latency"] if s.kind == "latency" else None
    ver = st.get("ver_id", {}).get(str(pg))
    p = prev.get(pg)
    if p is None or ver != p.ver or tx < p.tx or rx < p.rx:     # new, re-created, or TRex restarted
        prev[pg] = State(ver, tx, rx, tx - rx, max(0, tx - rx),
                         dict(lat["histogram"]) if lat else {})
        return None                                 # baseline only: no values for this interval

    dtx, drx, deficit = tx - p.tx, rx - p.rx, tx - rx
    new_loss = max(0, min(deficit, p.deficit) - p.reported)    # settled deficit minus already reported
    src_dc, dst_dc = APS[s.src_ap][3], APS[s.dst_ap][3]
    point = (Point("trex_stream")
             .tag("pg_id", str(pg)).tag("name", "pg%d" % pg).tag("kind", s.kind).tag("class", s.cls)
             .tag("src_ap", s.src_ap).tag("dst_ap", s.dst_ap).tag("src_dc", src_dc).tag("dst_dc", dst_dc)
             .tag("dc_pair", dc_pair(s.src_ap, s.dst_ap))
             .tag("src_vlan", str(s.src_vlan)).tag("dst_vlan", str(s.dst_vlan))
             .tag("tos", "0").tag("instance", "mon").tag("profile", "mini-monitor")
             .field("tx_pkts", tx).field("rx_pkts", rx)
             .field("drop_pkts", new_loss).field("drop_pkts_total", p.reported + new_loss)
             .field("tx_pps", dtx / dt).field("rx_pps", drx / dt)
             .time(ts, WritePrecision.S))

    if lat is not None and drx > 0:                 # without new packets TRex keeps old latency values
        err = st["latency"][pg]["err_cntrs"]
        for name, key in (("lat_avg_us", "average"), ("lat_min_us", "total_min"),
                          ("lat_total_max_us", "total_max"), ("lat_last_max_us", "last_max"),
                          ("jitter_us", "jitter")):
            if usable(float(lat[key])):
                point.field(name, float(lat[key]))
        mx = interval_max(lat, p)
        if mx is not None:
            point.field("lat_max_us", mx)
        for k, v in lat["histogram"].items():       # per-interval histogram, non-empty buckets only
            if v > p.hist.get(k, 0):
                point.field("hist_%d" % k, int(v - p.hist.get(k, 0)))
        point.field("seq_dropped", int(err["dropped"])).field("seq_ooo", int(err["out_of_order"]))
        point.field("seq_dup", int(err["dup"]))
        p.hist = dict(lat["histogram"])

    p.tx, p.rx, p.deficit, p.reported = tx, rx, deficit, p.reported + new_loss
    return point


# ------------------------------------------------------------------ InfluxDB
def flush(write_api, backlog):
    """Send buffered points in chunks; keep them on transient errors, drop on permanent ones."""
    while backlog:
        chunk = [backlog.popleft() for _ in range(min(5000, len(backlog)))]
        try:
            write_api.write(bucket=INFLUX_BUCKET, record=chunk)
        except ApiException as exc:
            if exc.status in PERMANENT:
                log.error("InfluxDB rejected %d points (HTTP %s): %s", len(chunk), exc.status, exc.body)
                continue
            backlog.extendleft(reversed(chunk))
            log.warning("InfluxDB write failed (HTTP %s), %d points buffered", exc.status, len(backlog))
            return
        except Exception as exc:                    # connection refused, timeout ...
            backlog.extendleft(reversed(chunk))
            log.warning("InfluxDB unreachable (%s), %d points buffered", exc, len(backlog))
            return


def main():
    logging.basicConfig(level=logging.INFO, format="%(asctime)s %(levelname)s %(message)s")
    c = STLClient(**TREX)
    emu = EMUClient(server=TREX["server"], sync_port=EMU_PORT)
    influx = InfluxDBClient(url=INFLUX_URL, token=os.environ["INFLUX_TOKEN"], org=INFLUX_ORG)
    write_api = influx.write_api(write_options=SYNCHRONOUS)
    backlog, prev = deque(maxlen=BACKLOG_POINTS), {}
    try:
        c.connect()
        emu.connect()
        pg_ids = apply(c, emu)                      # only the streams that were really started
        streams = [s for s in STREAMS if s.pg_id in pg_ids]
        last = time.monotonic()
        while True:
            time.sleep(max(0.0, last + INTERVAL - time.monotonic()))
            st = c.get_pgid_stats(pg_ids)           # absolute counters: never clear_stats() here
            now = time.monotonic()
            dt, last, ts = now - last, now, int(time.time())
            for s in streams:
                point = stream_point(s, st, prev, dt, ts)
                if point is not None:
                    backlog.append(point)
            flush(write_api, backlog)
    except TRexError as exc:
        log.error("TRex error: %s - exiting, systemd will restart the runner", exc)
        sys.exit(1)
    finally:
        influx.close()


if __name__ == "__main__":
    main()
How the parts map to the design:
| Part of the sketch | Design rule |
|---|---|
build_emu_profile() |
One namespace per (TRex port, S-VLAN, C-VLAN); tci=[S, C], outer first; deterministic MAC/IP; gateway per VLAN |
apply() |
reset() first (it switches promiscuous and service mode off), then port attributes and filtered service mode, then EMU, then streams per source port. The full load_profile() is acceptable only because the runner rebuilds everything at start-up; trexctl changes EMU incrementally |
build_stream() |
Explicit MACs, S-tag of the source AP, UDP checksum 0 for latency streams |
stream_point(), baseline branch |
Restart handling: ver_id, counters going backwards; no values for the baseline interval |
new_loss |
Settled deficit and high-water mark: packets in flight never become loss |
interval_max() |
lat_max_us = upper edge of the highest histogram bucket that grew in the interval |
drx > 0 condition |
No latency fields while nothing arrives |
dc_pair() |
Tag values rzk-rzk, rzk-rzc and rzc-rzc, as in the data model; the sketch measures no firewall streams, so it never writes the fourth value, x-fw |
flush() |
Bounded buffer, chunks of 5000, permanent HTTP errors dropped |
sys.exit(1) on TRexError |
Let systemd restart the runner; a restart re-applies everything |
Run it under systemd so that a TRex restart is followed automatically:
[Unit]
Description=Minimal TRex monitoring runner and exporter (bench)
After=trex-mon.service influxdb.service
Requires=trex-mon.service

[Service]
Type=simple
User=trexctl
EnvironmentFile=/etc/trexctl/secrets.env
ExecStart=/opt/trexctl/venv/bin/python /opt/trexctl/native/mini_monitor.py
Restart=always
RestartSec=10

[Install]
WantedBy=multi-user.target
confirm on the target OS The service user trexctl and /etc/trexctl/secrets.env
(one line INFLUX_TOKEN=..., mode 0600) are created as described in the next section. Requires=trex-mon.service also
means that restarting trex-mon restarts the runner, which then re-applies EMU clients and streams. Until TRex answers, the
runner exits with an error and systemd tries again ten seconds later.
Cross-check with a read-only console, which does not take the ports away from the runner:
trex> stats -s
trex> stats -l
trex> emu_show_all
stats -s must show the same TX/RX counters per pg_id as the tx_pkts/rx_pkts fields in InfluxDB, stats -l the
same latency values - for the first four or five pg_ids, which is all the console displays - and emu_show_all the five
clients with their resolved gateways.
Service integration, permissions and logging
The finished trexctl replaces the runner with the exporter service of the plan:
[Unit]
Description=trexctl statistics exporter (TRex -> InfluxDB)
After=trex-mon.service influxdb.service
Requires=trex-mon.service

[Service]
Type=simple
User=trexctl
Group=trexctl
EnvironmentFile=/etc/trexctl/secrets.env
ExecStart=/opt/trexctl/venv/bin/trexctl exporter run
Restart=always
RestartSec=5

[Install]
WantedBy=multi-user.target
useradd -r -s /sbin/nologin -d /data/trexctl trexctl
cat >/etc/sudoers.d/trexctl <<'EOF'
trexctl ALL=(root) NOPASSWD: /usr/bin/systemctl start trex-lab.service, \
    /usr/bin/systemctl stop trex-lab.service, \
    /usr/bin/systemctl start trex-lab-astf.service, \
    /usr/bin/systemctl stop trex-lab-astf.service
EOF
chmod 440 /etc/sudoers.d/trexctl
visudo -cf /etc/sudoers.d/trexctl
confirm on the target OS
- No root for trexctl. TRex runs as root, but its clients do not need to: they only open TCP connections to the local RPC ports. The only privileged action trexctl needs is switching NIC2 between stateless and ASTF for a test, and the sudo rule allows exactly those four commands - which is why the lab units are static files with fixed names (Chapter 17).
- A read-only exporter. The exporter service never acquires a trex-mon port and disconnects with
disconnect(stop_traffic=False); stopping or restarting it never touches the monitoring traffic. Onlytrexctl apply,updateandstopacquire the ports, and only while they run:applyreleases them again without stopping the traffic (release_ports=True), and the next command re-acquires them withforce=True. - Logs.
/var/log/trexctl/trexctl.log, rotating, one JSON object per line for machine processing. Important events (apply, stop, unresolved clients, changed gateway MACs and rebuilt streams, budget violations, InfluxDB write failures) are also written astrex_eventpoints - kindsannotation,apply,stop,testandgateway_mac_changed- so they appear as annotations in Grafana. - Automatic re-apply. The exporter has a supervisor thread that detects a trex-mon restart - the server uptime has
reset, or
active_streamshas fallen to zero while a profile is recorded as active in/data/trexctl/state/- and runstrexctl apply -p <active profile>once the server accepts connections again; it also restarts the gateway-MAC tracker. Monitoring is back without manual action. EMU is empty after a TRex restart, so this is - besides the first bring-up - the one situation in which the complete EMU profile is loaded.
Version control
The YAML files are the configuration of the monitoring system, so they are treated like switch configurations:
/etc/trexctlis a git working copy of the LVR repository. Every change is a commit with the ticket number.- A pre-commit hook runs
trexctl inventory validateandtrexctl plan; a change that breaks the schema or the budget cannot be committed. /data/trexctl/state/pgid-map.jsonis written by the trexctl service user, which is why it does not live under/etc. It matters as much as the inventory: losing it would not break TRex, but new pg_ids would cut every Grafana time series at the moment of the next apply. It is part of the nightly backup, and a copy goes into the configuration repository whenever it changes.- Dashboards and alert rules live in
/opt/trexctl/dashboardsand/opt/trexctl/alertsand are provisioned to Grafana from there, so a reinstall reproduces the same Grafana.
Development and acceptance
- Unit tests (pytest, no TRex needed) for inventory validation, profile expansion, pg_id allocation and the exporter arithmetic: deficit and settled loss, restart detection, interval maximum from synthetic histograms.
- Integration tests against a TRex instance in loopback (two DAC-connected ports, Chapter 17)
with the trex-mon settings (
--software --emu,c: 1), and packet-building tests with the TRex simulator. - Acceptance criteria:
trexctl apply -p monitoring-defaultbrings up all planned streams (74 latency + 102 loss-only) with resolved gateways within 60 s;trexctl statusmatches the console (stats -s,stats -l) for the pg_ids the console displays;- Grafana shows every stream within two polling intervals;
- restarting trex-mon produces a gap but no false loss, and the exporter's supervisor thread re-applies the profile automatically;
- adding an AP or a VLAN adds EMU clients without removing the existing ones, and the other groups keep running;
- a simulated gateway-MAC change (on the bench: swap the gateway MAC) triggers the rebuild of exactly the affected
streams within 15 s and writes a
gateway_mac_changedevent; the recovery after a real firewall failover is measured in the planned failover test confirm on device; - stopping and restarting the exporter does not interrupt the monitoring traffic;
- stopping InfluxDB for five minutes loses no points;
- an injected short delay (lab test) appears in
lat_max_usalthough it falls between twolast_maxwindows; trexctl test throughputreports line rate for 1518-byte frames in loopback.
Key takeaways
- trexctl is specified, not implemented. Until it exists, native TRex - console and Python API - runs the platform, and a small runner like the one in this chapter covers the essentials on the bench.
- Inventory and profiles are the single source of truth; everything else (addresses, MACs, EMU namespaces, pg_ids,
tags, Comware snippets) is derived from them, and pg_ids are persisted in
/data/trexctl/state/pgid-map.jsonso Grafana history stays continuous. Monitoring clients follow the per-AP formula; a lab port keeps one fixed MAC (02:54:52:f0:00:04for p4 ...:07for p7,mac:inports.lab=src_macin the TRex configuration) and only its IP follows the pinned AP. - Every group has a
kind: latency streams (at most 128, loss and latency) and flow-stat streams (up to 1023 in software mode, loss only). The default profile has 74 latency + 102 loss-only streams; the loss-only coverage is split by VLAN (l2-coverage-1315,l2-coverage-prod), and the DSCP groups (dscp-l2-interdc,dscp-entfw) include the BE reference. - The firewall zone follows option B, the plan's default: VLAN 4003 at K-BL and C-BL, the alias
FWZfor the lab pins, zone clients 10.9.90.106 / .113 and the lab client .156; option A is shown only as a marked alternative. - EMU namespaces are keyed by TRex port and
tci=[S-VLAN, C-VLAN]with the outer tag first; the ports need promiscuous, multicast and filtered service mode with a real mask constant such asNO_TCP_UDP_MASK. - The complete EMU profile is loaded only into an empty EMU (first bring-up, TRex restart), because
load_profileremoves all clients; later changes are incremental. Latency streams are rebuilt for a rate change. - The gateway-MAC tracker polls
dgw.rmacevery 10 s (forced re-resolution every 60 s) in the VLANs withgateway_mac_tracking, rebuilds all L3 streams sourced in that VLAN at that AP and writesgateway_mac_changed. Whether a firewall failover recovers within the plan's 15 s depends on how ClusterXL announces the new MAC - to be confirmed; a shorter ARP timer or a forced query closes the gap. - The exporter only reads - it never acquires a port and disconnects with
stop_traffic=False- and it computes rather than copies: rates from a monotonic clock, loss from the settled deficit, a baseline after every restart, and no latency fields while nothing arrives. Its supervisor thread re-applies the active profile after a trex-mon restart.trexctl applyends withdisconnect(stop_traffic=False, release_ports=True): the streams run on without an owner. last_maxcovers 0.5 s andaverageis low-pass filtered;lat_max_usis the upper edge of the highest histogram bucket that grew in the interval,hist_*holds the per-interval bucket counts, andlast_maxis kept aslat_last_max_usfor reference only. Every stream point also carriestx_bps,rx_bpsandrx_ok.- Writes use a write-only token, stable field types, a bounded buffer for transient failures, and an exporter-down alert.
Check your understanding
1. Why is drop_pkts not simply ΔTX − ΔRX of the interval?
At a poll some packets are in flight and the TX and RX counters are not read at the same instant. ΔTX − ΔRX would report a lost packet at one poll and a negative loss at the next. The planned exporter uses the smaller of the current and previous deficit (a packet in flight has arrived two seconds later) and reports only increases above what it has already written. Loss then appears one poll late, but in-flight packets never become loss.
2. A 300 µs spike happened 1.2 s before a poll. Which statistics show it?
The histogram delta of that interval contains it (bucket 300, i.e. 300-399 µs), so lat_max_us shows it - as 400 µs,
the upper edge of that bucket. last_max covers only the last 0.5 s window and misses it; the low-pass average
dilutes it. total_max (written as lat_total_max_us) shows the exact value only if 300 µs is a new lifetime record.
3. What would happen if the exporter called clear_stats() after every poll to get per-interval counters?
clear_stats() only moves the client's reference point. For latency streams it also resets the reference maximum
and from then on the client computes total_max from the last_max values it sees at each poll, so peaks between
polls would be lost. The exporter must work with absolute server counters and compute deltas itself.
4. trex-mon was restarted by systemd. Why does the dashboard show a gap instead of a burst of loss?
After the restart the counters start at zero (and the re-created streams have a new ver_id). The exporter detects
this, stores a new baseline and writes no values for that interval. Without that rule, the counter drop would turn
into a huge negative delta or into apparent loss.
5. Why does the sketch write latency fields only when rx_pps > 0?
TRex updates the latency window only when packets arrive; during an outage average and last_max keep their old
values. Writing them would draw a flat, healthy-looking latency line through an outage. Leaving the fields out
produces a gap that matches the loss and path-down panels.
6. InfluxDB answers HTTP 422 to a write. Should the exporter keep the points and retry?
No. 422 means the points were rejected for semantic reasons, for example a field type conflict (a float field written as an integer). Retrying the same data cannot succeed; the batch is logged and dropped, and the cause - usually a missing type cast - is fixed. Connection errors and 5xx/503 are transient: those points are buffered and re-sent, which is harmless because a point with the same series and timestamp overwrites the earlier one.
7. Why does every stream leave through the TRex port of its source attachment point, although both monitoring ports carry all S-VLANs?
The TX switch learns each client MAC on the trunk port it arrives from. If one client sent from both TRex ports, its MAC would flap between them, return traffic would reach the wrong port, and TRex would count loss while the switch reports MAC moves. One port per AP makes the forwarding deterministic.
8. What protects the Grafana history when somebody rewrites the profile file?
pg_ids are allocated by key (class, kind, APs, VLANs, TOS) and persisted in /data/trexctl/state/pgid-map.json,
which is backed up nightly and copied into the configuration repository whenever it changes. A stream that keeps
its key keeps its pg_id - and therefore its InfluxDB series - whatever its position in
the file. The pre-commit hook runs trexctl plan, which shows any new pg_ids before they are applied.
References
- TRex STL Python API,
STLClient:get_pgid_stats(latency dictionary, histogram,last_max, low-passaverage),get_stats,clear_stats,reset,disconnect(stop_traffic),set_service_mode(masks),set_port_attr,stop/wait_on_traffic(rx_delay_ms): https://trex-tgn.cisco.com/trex/doc/cp_stl_docs/api/client_code.html - TRex stateless guide, "Per stream latency/jitter/packet errors" (limits, error counters, 0.5 s window, multiplier not applied to latency streams), "Port service mode", "Dynamic multiple profiles": https://trex-tgn.cisco.com/trex/doc/trex_stateless.html
- TRex EMU guide, "Python API" and "Tutorial: Load TRex server in multi-core": https://trex-tgn.cisco.com/trex/doc/trex_emu.html
- trex-core source (master = v3.08):
trex/stl/trex_stl_stats.py(relative counters,ver_id,total_maxafter clear),trex/stl/trex_stl_streams.py(explicit MACs),trex/common/trex_client.py(mask constants,service --emu,disconnect(stop_traffic=True)default),trex/emu/trex_emu_client.py(load_profileremoves all namespaces and clients first;add_ns,add_clients,remove_clients,remove_ns,get_all_ns_and_clients,dgw),trex/emu/trex_emu_profile.py(EMUClientKey),trex/emu/emu_plugins/emu_plugin_arp.py(clienttimer, default 60 s;cmd_query(c_key, garp); consolearp_cmd_querywith--garp),src/time_histogram.cpp(buckets, 0.5 s update, low-pass average, no update without samples),src/stx/stl/trex_stl_fs.cpp(latency signature and TOS bit 0, the reason for UDP checksum 0),src/main_dpdk.cpp(--hdrh): https://github.com/cisco-system-traffic-generator/trex-core - trex-emu source,
src/emu/plugins/arp/arp.go(periodic query, immediate update from ARP requests, broadcast replies dropped): https://github.com/cisco-system-traffic-generator/trex-emu - influxdb-client for Python (1.50):
InfluxDBClient,write_api(write_options=SYNCHRONOUS),Point,WritePrecision,ApiException: https://github.com/influxdata/influxdb-client-python - InfluxDB OSS v2: line protocol (data types), "Troubleshoot issues writing data" (HTTP status codes),
influx auth create(--write-bucket), token hashing in 2.9: https://docs.influxdata.com/influxdb/v2/ - systemd.unit(5) for
Requires=andAfter=: https://www.freedesktop.org/software/systemd/man/latest/systemd.unit.html - Plan document v0.92 (14 October 2026), sections 4.6.3 (lab client identity), 9.1-9.11 (trexctl specification: 9.2 file layout, 9.3 inventory, 9.4 profiles, 9.5 stream generation and gateway-MAC tracker, 9.6 command line, 9.7 data model, 9.10 service integration and supervisor thread), 10.1-10.3 (InfluxDB and Grafana installation), 10.5 (alert rules) and 12.3 (acceptance)