23. Scenarios - maintenance and incidents
In this chapter
You will learn
- how to measure convergence during planned maintenance (IRF member reboot, Leaf uplink failure, DCI member failure, firewall failover, ISSU) and how to read the result: outage = lost packets / pps
- why streams through a rebooted member's attachment point show the full downtime, and what the other streams tell you
- how to validate a change with a before/after comparison per class
- a repeatable incident method - symptom, hypotheses, checks, conclusion - applied to seven typical cases: a path down on one AP, loss on all RZC streams, a latency step on the firewall classes, one-direction loss, MAC-move alarms, jitter on the inter-DC streams and "everything red"
- which Comware and TRex commands answer each question, and which conclusions are production incidents
Prerequisites: Chapter 5, Chapter 14, Chapter 16, Chapter 19, Chapter 20, Chapter 21
The platform pays for itself in two situations: when somebody changes the network on purpose and wants to know what the change cost, and when something changes without anybody wanting it. This chapter covers both. Procedures M1 and M2 are for planned work; I1 to I7 are worked incident examples. They all rely on one property of the platform: every stream is a fixed, known path, so the set of affected streams already says where the problem is.
The incident method
Every incident in this chapter is worked the same way:
- Symptom - what Grafana and the alerts show, described by scope: which streams (class, source AP, destination AP, direction), since when, loss or latency or both.
- Hypotheses - the elements that all affected streams share and the unaffected streams do not. Write them down before logging in anywhere.
- Checks - one or two commands per hypothesis that confirm or exclude it. Instrument checks first (Chapter 20).
- Conclusion - cause, domain (fabric, firewall, platform), production impact, action, annotation.
Collect evidence with timestamps: Grafana panels with the absolute time range, TRex output, device output. All fabric
switches synchronise to the LVR NTP servers (ntp-service unicast-server 10.0.31.21 / 10.0.31.23 in the running
configurations), and the TRex server is set up to use the same servers (Chapter 17) - so
display logbuffer timestamps and Grafana time axes can be compared directly. Check the server with chronyc tracking
when timing matters.
M1 - Measuring convergence during planned maintenance
Goal
For a planned event - an IRF member reboot, a Leaf uplink failure, a DCI member failure, a firewall failover, an ISSU - measure for every affected stream how long packets were lost, when the loss started and ended, and whether the result matches the expectation. The output is an outage table per stream and per AP pair, attached to the change ticket.
What you set and why
First decide which streams can see the event at all. A stream is affected only if its path contains the element under maintenance (Chapter 14):
| Event | Streams that see it | What they measure | Rate during the window |
|---|---|---|---|
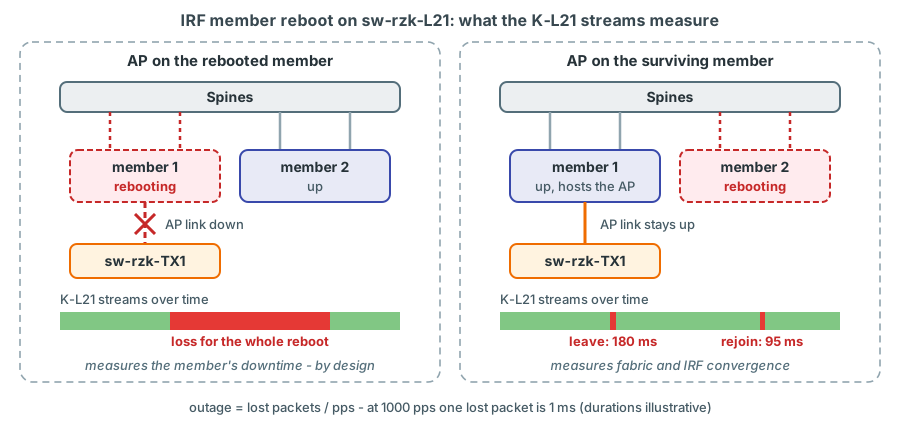
| Leaf IRF member reboot, the member that hosts the AP port | All streams of that AP | The AP link is down for the whole reboot: member downtime, not convergence | Default rate is enough |
| Leaf IRF member reboot, the other member | All streams of that AP | Fabric and IRF convergence when the member leaves and when it rejoins | 1000 pps for the AP's groups |
| Leaf uplink failure | Streams of that Leaf's AP whose flows are hashed onto the failed uplink | ECMP re-convergence | 1000 pps |
DCI member failure (Route-Aggregation1 member) |
L2 inter-DC streams and routed streams from RZC sources | Link aggregation failover | 1000 pps for l2inter, 1.l3bl |
| Border Leaf IRF member reboot | Streams through that Border Leaf: L3-BL, inter-DC, firewall classes, the BL's own AP | Gateway and DCI failover (sw-rzk-BL has one DCI member per IRF member: HGE1/2/1 and HGE2/2/1) |
1000 pps for fabric groups |
| Firewall cluster failover | L3-DCFW or L3-ENTFW | Failover gap on the streams sent to a switch gateway (L3-ENTFW from VLAN 1314), followed by a latency step if the active member changes DC (I3). Streams sent to a firewall member MAC (all L3-DCFW, the zone side of L3-ENTFW and DSCP) lose packets until they are rebuilt - their gap is failover plus detection plus rebuild, not the failover time | Stays at 50 pps, at most 100 pps |
| ISSU on an IRF fabric | As for the member reboots, one member after the other | Per member: as above | As above |
Raise the affected fabric groups to 1000 pps (1 ms resolution) within the 50 kpps budget - if necessary only one port half (S5 in Chapter 21); keep firewall groups at their rate (at most 100 pps, which gives 10 ms resolution); annotate the window and every single action with its exact time; silence the affected streams.
Production impact
The platform only observes. Even raised, the monitoring adds a few tens of kpps of small frames - negligible on 10G APs and the 2 x 40G DCI - and it does not influence how the fabric converges. Two things need care: streams through firewalls stay within the 100 pps guard rail, and no lab test runs across the DCI or the TX-to-TX link during a measurement window.
Why an AP on the rebooted member shows the full downtime
Each AP is a single 10G link to one IRF member - by design, because the TX switch must never bridge two links into the same Leaf pair. When that member reboots, the AP link goes down and every stream of the AP loses packets until the member is back and the link is up again. That number measures the reboot, not the fabric. To measure how fast the fabric reacts to the loss of a member, look at an AP on the member that stays up.
Firewall failover: streams with a firewall destination MAC
In February 2025 both firewall clusters answered ARP with the MAC of the active member; no virtual MAC was seen. A stream whose destination MAC is a firewall MAC - every L3-DCFW stream, and the L3-ENTFW and DSCP streams sent from the zone clients - carries the MAC that was resolved when the stream was built. After a failover it is still sent to the old member and loses packets until it is re-created with the newly resolved MAC; the stream does not follow EMU's resolution by itself.
trexctl's gateway-MAC tracker (planned) polls dgw.rmac every 10 s and rebuilds the affected streams (event
gateway_mac_changed, information alert "Gateway MAC changed"). How fast EMU learns the new MAC depends on how
ClusterXL announces it: a gratuitous ARP request is learned at once, a broadcast ARP reply is ignored and the next
periodic query (every 60 s by default) is needed. The plan's target of 15 s therefore needs a shorter ARP timer for
the firewall VLANs or a forced query confirm on device - the first planned
failover is the test of this acceptance criterion.
For a failover test this means: read the failover gap from the streams that are sent to the sw-rzk-BL gateway
(L3-ENTFW from VLAN 1314; a DC-FW failover has no such streams, because every L3-DCFW stream is sent to a firewall
MAC). Until the tracker exists, rebuild the other firewall streams by hand right after the failover (incident I3)
and record the time of the rebuild. With a ClusterXL virtual MAC the rebuild would not be needed
(Appendix D) confirm with the firewall
team during the first planned failover.
How it works
At 1000 pps consecutive packets of a stream are 1 ms apart. During an outage the network drops every packet; TRex keeps sending and counts transmitted and received packets per pg_id. After the outage:
- Outage duration = lost packets / pps. At 1000 pps, 347 lost packets mean 347 ms (± 1 ms). This value comes from counters and is precise to one packet interval.
- Position in time comes from the exporter's per-interval drop series. With a 2 s sampling interval the first and last loss are known to ±2 s; the planned convergence runner can sample every 1 s.
- Several outages in one window - a member leaving and later rejoining - appear as separate bursts in the time series. The counter difference over the whole window is their sum.
- Latency streams add sequence information. The
out_of_orderanddupcounters show transient re-ordering or duplication while two paths were briefly active.
Watch three things in the animation: the stream runs at 1000 pps, so each missing packet stands for one millisecond; the lost packets are counted, not timed - the duration is computed afterwards from the count; and traffic resumes on its own once the network has converged, without anything being restarted on the TRex side.
Step by step
Before the window (at least 30 minutes earlier).
- Map the event to streams with the table above. For a Leaf IRF reboot, find the member that hosts the AP: the first
number of the interface name is the IRF member (
Ten-GigabitEthernet1/3/1is on member 1);display irfshows the members and their roles (Virtual Technologies CR PDF p. 4). - Check the starting point: Overview green, all affected streams RX = TX for at least 15 minutes.
- Raise the affected groups to 1000 pps (S5 in Chapter 21) - early enough that the short gap of re-creating latency groups lies outside the window. Verify the new rate in Grafana.
- Silence the affected alerts and set the start annotation.
Raise the rates as in S5. To get an outage table independent of Grafana, start this read-only script before the window and stop it with Ctrl+C afterwards. Because a client's counters start at zero when it connects (Chapter 20), TX minus RX at the end is exactly the loss during the window:
import csv, time
from trex.stl.api import STLClient

rows = {int(r['pg_id']): r for r in csv.DictReader(open('/data/trexctl/state/stream-table.csv'))}
watch = {pg: 1000.0 for pg, r in rows.items()
         if r['group'] == 'l2inter' or (r['group'] == 'l3bl' and r['port'] == '1')}  # (1)!

c = STLClient(server='127.0.0.1', sync_port=4501, async_port=4500)
c.connect()                                 # read-only, counters start at zero now
prev, first, last = {}, {}, {}
try:
    while True:
        st = c.get_pgid_stats(list(watch))
        now = time.strftime('%H:%M:%S')
        for pg in watch:
            fs = st['flow_stats'].get(pg, {})
            gap = fs.get('tx_pkts', {}).get('total', 0) - fs.get('rx_pkts', {}).get('total', 0)
            if gap - prev.get(pg, gap) > 2:      # (2)!
                first.setdefault(pg, now)
                last[pg] = now
            prev[pg] = gap
        time.sleep(1)
except KeyboardInterrupt:
    st = c.get_pgid_stats(list(watch))
    for pg in sorted(watch):
        fs = st['flow_stats'].get(pg, {})
        lost = fs.get('tx_pkts', {}).get('total', 0) - fs.get('rx_pkts', {}).get('total', 0)
        if lost > 2:
            print(f"{rows[pg]['name']:42s} lost={lost:<7d} outage={lost / watch[pg] * 1000:.0f} ms "
                  f"first={first.get(pg)} last={last.get(pg)}")
finally:
    c.disconnect(stop_traffic=False)
- Watch only the raised groups; their rate during the window is 1000 pps.
- TX minus RX includes a few packets in flight; a jump of more than two packets within one second marks a second with loss.
sketch - validate on the bench (get_pgid_stats(pgid_list), counters relative
to the client's connect time: trex-core trex_stl_stats.py).
trexctl test convergence --group l2-inter-dc,l3-bl --pps 1000 --duration 3600
trexctl annotate "Maintenance CHG-12345: window start"
The convergence runner raises the groups, records cumulative drops per stream before and after the event, computes outage = drops / pps with first and last loss per stream and per AP pair, and restores the original rates at the end.
During the window.
- Annotate every action with its exact time ("T0 reboot sw-rzk-L21 member 2").
-
Watch the "Loss and outages" dashboard. On the devices, follow the event:
<sw-rzk-L21> display irf
<sw-rzk-L21> display interface brief
<sw-rzk-L21> display logbuffer
<sw-rzk-BL> display link-aggregation verbose route-aggregation 1
verified Virtual Technologies CR PDF p. 4 (
display irf); L2 CR PDF p. 56 (display interface brief), pp. 127-128 (display link-aggregation verbose); Network Management and Monitoring CR PDF p. 423 (display logbuffer). The link up/down messages in the log buffer (IFNET/3/PHY_UPDOWN,IFNET/5/LINK_UPDOWNin the LVR diagnostic files) give the device-side timestamps to compare with the loss bursts.For a firewall failover, follow it in the ARP table of
sw-rzk-BL(I3) and rebuild the streams with a firewall destination MAC as soon as the cluster has switched and EMU shows the new member MAC (force a query if it does not, I3 checks 5 and 6); annotate the rebuild with its time. With the planned tracker, itsgateway_mac_changedevent marks the rebuild.
After the window.
- Wait until the maintained element is completely back and all streams have run with RX = TX for at least five minutes; set the end annotation.
-
Read the result. In Grafana ("Loss and outages") or directly with Flux:
Outage per stream in the selected time rangepps = 1000.0 from(bucket: "trex") |> range(start: v.timeRangeStart, stop: v.timeRangeStop) |> filter(fn: (r) => r._measurement == "trex_stream" and r._field == "drop_pkts") |> group(columns: ["name", "class", "src_ap", "dst_ap"]) |> sum() |> map(fn: (r) => ({r with outage_ms: float(v: r._value) * 1000.0 / pps})) |> sort(columns: ["outage_ms"], desc: true)First interval with loss per stream (use last() for the last one)from(bucket: "trex") |> range(start: v.timeRangeStart, stop: v.timeRangeStop) |> filter(fn: (r) => r._measurement == "trex_stream" and r._field == "drop_pkts" and r._value > 0) |> group(columns: ["name"]) |> first()sketch - validate in the Data Explorer field and tag names follow the planned data model (Chapter 18);
v.timeRangeStart/v.timeRangeStopare the Grafana time-range variables. -
Restore the rates (S5), expire the silence, write the report: outage per stream and per AP pair, first and last loss, device log timestamps, interpretation. Planned:
trexctl report --test <id> --format md.
What you should see
illustrative values Example: sw-rzk-L21 member 2 is rebooted; the AP K-L21 is on
member 1.
| Stream | Lost packets at 1000 pps | Outage | Reading |
|---|---|---|---|
| K-L21 to K-BL, VLAN 1314 | 180 at T0 + 95 at rejoin | 180 ms + 95 ms | Convergence when member 2 leaves and when it rejoins |
| K-BL to K-L21, VLAN 1314 | 0 at T0 + 120 at rejoin | 0 ms + 120 ms | The reverse direction can differ: other spine, other ECMP decision |
| K-L21 to C-L21, VLAN 1314 | 210 + 90 | 210 ms + 90 ms | Same Leaf, longer path |
| K-L11 to C-L11, VLAN 1314 | 0 | 0 | Path does not touch sw-rzk-L21 |
Had member 1 been rebooted, every K-L21 stream would show one long outage of the order of the member's reboot time and the "path down" rule would fire - expected, and silenced.
Questions to ask of the table: are both directions of a pair similar, do the bursts line up with the link messages in
display logbuffer, does the result match earlier windows of the same type? Loss on a stream outside the expected scope
is a finding in itself.
Rollback / cleanup
Restore the rates exactly as in S5, remove or expire the silence, set the end annotation and archive the report with the ticket.
Risks
| Risk | Avoidance |
|---|---|
| Raised rates are forgotten | End annotation, handover note; planned convergence runner restores automatically |
| Budget exceeded by raising too many groups | Raise only affected groups or port halves; calculate first |
| Firewall streams raised above 100 pps | Keep them at their rate unless the firewall team agrees |
| A lab test across the TX-to-TX fibre during the window disturbs RZC measurements | No lab tests during measurement windows |
| Clock offset between devices and server | NTP on all devices and the server; check chronyc tracking |
M2 - Post-change validation (before/after comparison)
Goal
Show, per traffic class and per AP pair, that a change - new firmware, a new firewall policy, a changed DCI, a new Leaf - did not degrade latency, jitter or loss, or document by how much it changed them.
What you set and why
| Item | Recommendation | Why |
|---|---|---|
| "Before" window | 24 hours (or more) before the change, without annotated events | A whole day contains the daily load pattern |
| "After" window | Same length and same time of day/weekday, starting after the change has settled | Avoids comparing a busy afternoon with a quiet night |
| Metrics | Per class and pair: median and 99th percentile of lat_avg_us, 99th percentile of the interval maximum lat_max_us, 99th percentile of jitter_us, total drop_pkts |
Median shows shifts, p99 shows tails, drops show loss |
| Acceptance criteria | Agreed before the change: no new loss; median and p99 within the spread observed in the baseline; every step explained | Prevents arguing about thresholds afterwards |
How it works
The streams after the change are the same streams as before - same pg_ids, APs and paths, unless the change altered them. A difference is therefore the change itself, a path change (for example the active firewall member) or a load effect, which is why the windows must match in time of day.
Step by step
- Before the change: write down the windows and the criteria in the ticket.
- Grafana: in the "Class detail" dashboard, duplicate the latency panel and set its Time shift to the distance between
the windows (for example
1d). Both curves then lie on top of each other. Panel time overrides have no effect when the dashboard time range is absolute, so use a relative range such as "last 24 hours". -
Numbers per window with Flux (run once per window):
Median per class and pair in one window (change q for other quantiles)from(bucket: "trex_longterm") |> range(start: 2026-10-20T06:00:00Z, stop: 2026-10-21T06:00:00Z) |> filter(fn: (r) => r._measurement == "trex_stream" and r._field == "lat_avg_us") |> group(columns: ["class", "src_ap", "dst_ap", "src_vlan", "dst_vlan"]) |> quantile(q: 0.5) -
Compare against the criteria; for each difference outside them, find the explanation or open an incident.
- Record the comparison table in the ticket.
There is no planned trexctl command for this comparison; it is a Grafana and Flux task.
What you should see
illustrative values
| Class / pair | Median before | Median after | p99 before | p99 after | Drops after | Verdict |
|---|---|---|---|---|---|---|
| L2 intra-RZK, K-L11 to K-BL | 21 µs | 21 µs | 26 µs | 27 µs | 0 | unchanged |
| L2 inter-DC, K-L21 to C-L21 | 180 µs | 181 µs | 196 µs | 198 µs | 0 | unchanged |
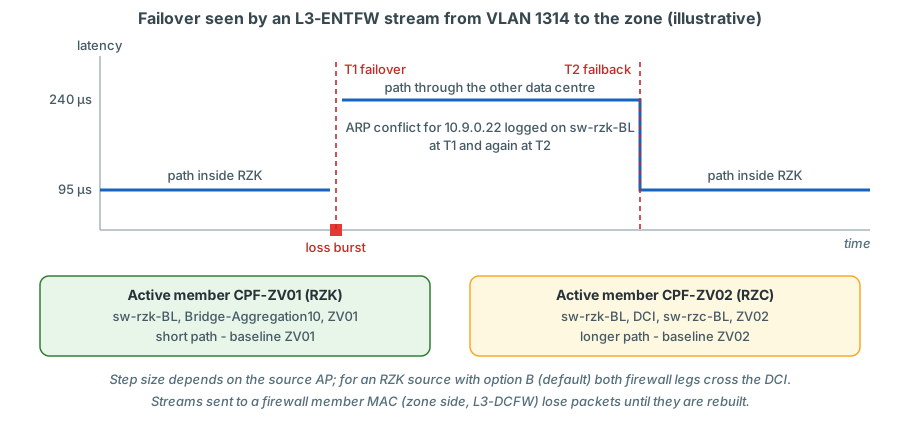
| L3-ENTFW, K-L11 to the zone client at K-BL | 95 µs | 240 µs | 130 µs | 290 µs | 0 | step: active member now in RZC - see I3 |
Rollback / cleanup
M2 is an analysis. If the validation fails, the rollback is the rollback of the network change, decided by its owner.
Risks
| Risk | Avoidance |
|---|---|
| Comparing different times of day | Matching windows |
| The maintenance window itself inside "after" | Start "after" when the change has settled |
| A firewall member change mistaken for degradation | Check the active member (I3) before concluding |
| RZC versus RZK offsets mixed up | Compare each pair with itself, never across DCs |
I1 - Path down on one attachment point
Symptom. The "path down" rule fires for every stream with src_ap=K-L21 or dst_ap=K-L21, all classes, both
directions: TX continues at the planned rate, RX is 0. All other streams are healthy, the instrument row is green.
Hypotheses. Everything that only the K-L21 streams share:
- The AP link is down: fibre, optic, TX switch port XGE1/1/3, Leaf port.
- The IRF member of
sw-rzk-L21that hosts the AP port is down or rebooting. - The TX switch AP port lost its configuration (PVID 3103, QinQ).
- The Leaf AP port lost its service instances, or the VSI is down on that Leaf.
An EMU problem is unlikely: it would break address resolution for routed streams, not the L2 streams, whose MACs are learned from the traffic itself.
Checks.
| # | Where | Command | What it tells you |
|---|---|---|---|
| 1 | sw-rzk-TX1 |
display interface brief |
Link state of XGE1/1/3 |
| 2 | sw-rzk-TX1 |
display interface Ten-GigabitEthernet1/1/3 |
Current state, last link flapping, input errors and CRC |
| 3 | sw-rzk-TX1 |
display transceiver diagnosis interface Ten-GigabitEthernet1/1/3, display transceiver alarm interface Ten-GigabitEthernet1/1/3 |
Optical RX/TX power, alarms such as "RX loss of signal" |
| 4 | sw-rzk-TX1 |
display qinq, display vlan 3103 |
XGE1/1/3 still QinQ-enabled and untagged in 3103 |
| 5 | sw-rzk-TX1 |
display mac-address vlan 3103 |
MACs learned on XGE1/1/3 = frames come back from the Leaf |
| 6 | sw-rzk-TX1 |
display lldp neighbor-information list |
Is sw-rzk-L21 seen on XGE1/1/3? |
| 7 | sw-rzk-L21 |
display irf, display logbuffer |
Member state; link and reboot messages with time |
| 8 | sw-rzk-L21 |
display l2vpn service-instance interface <AP port> |
Instances 1314/1315 Up and bound to the VSIs |
| 9 | sw-rzk-L21 |
display l2vpn mac-address vsi VPN-1314 |
0254-5203-0522 (K-L21 client) learned on the AP port? |
verified L2 CR PDF pp. 47-50, 56, 193, 11, 277, 355; Fundamentals CR PDF pp. 289-291; Virtual Technologies CR PDF p. 4; NMM CR PDF p. 423; VXLAN CR PDF pp. 13-16.
Read them in order: link down (1-3) means a physical cause; link up but no MACs from the Leaf side (5) points to the Leaf
port or the IRF member (7, 8); MACs present in both directions while TRex still sees no RX points back to the instrument
(stats --ps, EMU) - rare.
Conclusion and action.
- During an IRF maintenance on member 1: expected; annotate. Nothing to fix.
- Optic or fibre fault: replace; measurement-only impact, because the AP carries no production traffic.
- Configuration lost on the TX switch or the Leaf: restore from the inventory (planned:
trexctl inventory render-tx/render-leaf --ap K-L21) and find out who changed it. - VSI down on the Leaf: that is a production problem for every port in the VLAN - escalate to the network team at once.
I2 - Loss on all RZC streams
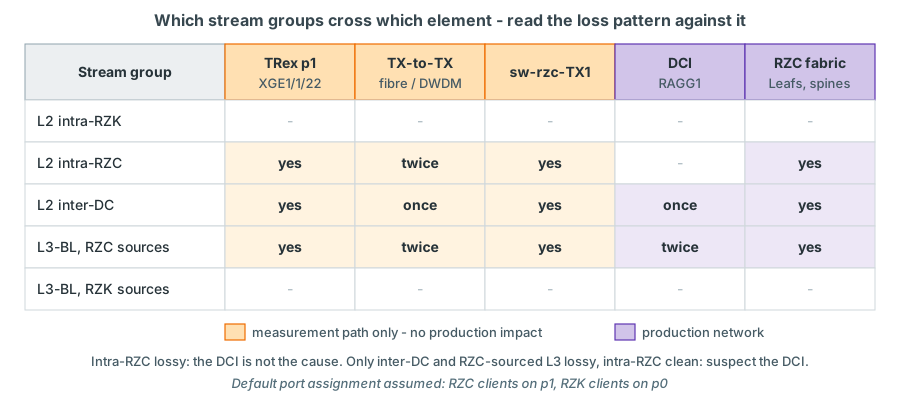
Symptom. Loss (or path down) on every stream with an RZC endpoint: intra-RZC L2, inter-DC L2, routed streams from RZC sources. Intra-RZK streams are clean. The instrument row is green.
Hypotheses. The elements that every RZC stream shares - and the one element that only some of them use:
- The TX-to-TX fibre or DWDM channel (errors, degraded optics, flaps).
sw-rzc-TX1(reboot, power, overload by a lab test).- TRex port p1 or its link to
sw-rzk-TX1XGE1/1/22 - p1 holds all RZC clients. - The DCI
Route-Aggregation1between the Border Leafs - production. - A fabric-wide problem in RZC (spines) - production.
Checks.
| # | Where | Command | What it tells you |
|---|---|---|---|
| 1 | Grafana | Filter dc_pair: are intra-RZC streams lossy? |
Yes: not the DCI (hypotheses 1, 2, 3, 5). No, only inter-DC: DCI (4) |
| 2 | both TX switches | display interface HundredGigE1/2/1 |
Errors and CRC on the receiving side, last link flapping |
| 3 | both TX switches | display transceiver diagnosis interface HundredGigE1/2/1, display transceiver alarm interface HundredGigE1/2/1 |
Optical power compared with the alarm thresholds |
| 4 | sw-rzk-TX1 |
display interface Ten-GigabitEthernet1/1/22 |
Link to p1 |
| 5 | TRex (read-only) | stats --ps, stats -p, stats -x |
p1 link state, ierrors/oerrors, NIC extended counters |
| 6 | sw-rzc-TX1 |
display logbuffer, display interface brief |
Reboot or AP links down |
| 7 | server | systemctl is-active trex-lab trex-lab-astf |
A lab test running across the TX-to-TX link? |
| 8 | sw-rzk-BL, sw-rzc-BL |
display link-aggregation verbose route-aggregation 1, display interface HundredGigE1/2/1, display interface HundredGigE2/2/1 |
DCI members selected, error-free |
verified L2 CR PDF pp. 47-50, 56, 127-128; Fundamentals CR PDF pp. 289-291; NMM CR
PDF p. 423; DCI members HundredGigE1/2/1 and HundredGigE2/2/1 in Route-Aggregation1 from the running configurations of
both Border Leafs. Interface names on the TX switches assume the reference module layout
confirm on device.
Conclusion and action.
- TX-to-TX fibre,
sw-rzc-TX1or p1: measurement-only - production is not affected - but every RZC measurement is invalid until it is fixed. Annotate, silence the RZC streams, open a ticket with the transport or platform owner. - DCI or RZC fabric: a production incident. Escalate to the network team immediately with the TRex evidence: which streams, since when, how much loss.
I3 - Latency step on the firewall classes
Symptom. At one moment all L3-ENTFW streams (or all L3-DCFW streams) change their latency by a similar amount and stay at the new level; a short loss burst may coincide with the step. L2 and L3-BL streams are unchanged. At the same moment the streams sent to a firewall MAC - every L3-DCFW stream after a DC-FW failover, the L3-ENTFW and DSCP streams of the zone clients after an ENT-FW failover - may lose all their packets and stay "path down" until they are rebuilt (with the planned tracker: the information alert "Gateway MAC changed" marks the rebuild).
Hypotheses.
- Cluster failover: the active firewall member is now in the other data centre, so the path crosses the DCI - with the default firewall-zone option B, for an RZK source both firewall legs (to the member and back through VSI VPN-4003); with option A also the TX-to-TX fibre on the zone side - a step, typically with a short loss burst. Streams that carry the old member MAC as destination keep losing packets until they are rebuilt (see M1).
- A firewall policy or inspection change (for example Threat Prevention enabled for the TRex traffic) - usually higher latency and higher jitter, not a clean step.
- A routing change in VPN-CORE (another next hop for the zone or the transfer network).
- Load on the firewall - gradual, follows the daily pattern.
Checks.
| # | Where | Command | What it tells you |
|---|---|---|---|
| 1 | Grafana | All streams of the class at the same moment? Clean step or noisy rise? | Clean simultaneous step: cluster event (1) |
| 2 | sw-rzk-BL |
display arp vpn-instance VPN-CORE |
MAC currently answering for the firewall next hop 10.9.0.22 |
| 3 | sw-rzk-BL |
display l2vpn mac-address vsi VPN-4002 |
Is that MAC local on Bridge-Aggregation10 (CPF-ZV01, RZK) or behind a tunnel towards sw-rzc-BL (CPF-ZV02, RZC)? |
| 4 | sw-rzk-BL |
display logbuffer |
ARP conflict messages for 10.9.0.22 around the time of the step |
| 5 | TRex (read-only, --emu) |
emu_show_client_info -p 0 --vlan 3110 4003 --tpid 0x8100 0x8100 --mac 02:54:52:06:0f:a3 --json (zone client at K-BL; for the zone client at C-BL: -p 1 --vlan 3210 4003, --mac 02:54:52:0d:0f:a3) |
dgw.rmac = the firewall MAC the zone client resolves now; if it differs from the destination MAC in the stream table, the zone-side streams must be rebuilt. The same check for the source clients of L3-DCFW |
| 6 | TRex (--emu, platform administrator) |
emu_arp_cmd_query -p 0 --vlan 3110 4003 --mac 02:54:52:06:0f:a3 --garp off |
Forces an ARP query for the zone client's gateway now. Needed when dgw.rmac still shows the old member: EMU ignores ARP replies sent to the broadcast address and otherwise waits for its periodic query (every 60 s by default); repeat check 5 afterwards |
| 7 | sw-rzk-BL |
display ospf 1 peer |
Neighbour 10.9.0.22 still Full in OSPF 1 (VPN-CORE) |
| 8 | sw-rzk-BL, sw-rzc-BL |
display ip routing-table vpn-instance VPN-CORE 10.9.90.0 24 |
Route to the zone unchanged |
| 9 | firewall team | Cluster state history | Confirms or excludes a failover |
verified L3 IP Services CR PDF p. 33; VXLAN CR PDF pp. 13-15; NMM CR PDF p. 423;
L3 IP Routing CR PDF p. 181 (display ospf peer), p. 26 (display ip routing-table). EMU console options from trex-core
parsing_opts.py and the ARP plugin emu_plugin_arp.py (arp_cmd_query, --garp on|off)
confirm on the bench for the exact namespace key.
In the LVR fabric: what a member change looks like in the Border Leaf log
The log buffer of sw-rzk-BL (file diag_sw-rzk-BL_20250217-163816.txt, section display logbuffer) contains pairs
of messages like these:
%Oct 30 13:34:42:003 2024 sw-rzk-BL ARP/4/ARP_DUPLICATE_IPADDR_DETECT: Detected an IP address conflict. The device with MAC address 001c-7f65-8ec8 connected to interface Bridge-Aggregation10 service-instance 4002 in VSI VPN-4002 and the device with MAC address 001c-7f65-ff14 connected to interface Tunnel5 in VSI VPN-4002 were using the same IP address 10.9.0.22.
%Oct 30 14:10:31:860 2024 sw-rzk-BL ARP/4/ARP_DUPLICATE_IPADDR_DETECT: Detected an IP address conflict. The device with MAC address 001c-7f65-ff14 connected to interface Tunnel5 in VSI VPN-4002 and the device with MAC address 001c-7f65-8ec8 connected to interface Bridge-Aggregation10 service-instance 4002 in VSI VPN-4002 were using the same IP address 10.9.0.22.
Both firewall members claimed the next hop 10.9.0.22 within a short time - 001c-7f65-8ec8 on
Bridge-Aggregation10 (CPF-ZV01 in RZK) and 001c-7f65-ff14 behind a VXLAN tunnel (CPF-ZV02 in RZC) - and about
36 minutes later in the opposite order: consistent with a change of the answering member and a change back
confirm with the firewall team. With the platform in place, each such pair lines
up with a latency step on the firewall classes and its reversal.
Conclusion and action.
- Planned failover: expected; annotate; check that the loss at the step matches the expected failover time - on the
streams sent to the
sw-rzk-BLgateway, not on the streams sent to a firewall MAC. - Streams sent to the old member MAC: rebuild them. First make sure that EMU has learned the new MAC (checks 5 and
6), then write the new
dgw.rmacinto the stream table and re-create the affected groups, for examplestart -f /opt/trexctl/profiles/raw/lvr_mon_streams.py -p 0.l3entfw 1.l3entfw --force -t group=l3entfw(the zone clients at K-BL and C-BL send from port 0 and port 1), the same for0.dscpand - after a DC-FW failover - for0.l3dcfw 1.l3dcfw. Their latency counters restart. Planned: the gateway-MAC tracker oftrexctldoes this by itself (M1) and writes the eventgateway_mac_changed; the plan's recovery target of 15 s is still to be confirmed in the first planned failover. A ClusterXL virtual MAC would make the rebuild unnecessary - an open decision with the firewall team (Appendix D). - Unplanned failover: a production event - the firewall team investigates why the cluster failed over.
- Alerting: if the cluster may legitimately stay on either member, record a baseline for each member location and build the latency rule for the firewall classes so that both are normal (Chapter 19).
I4 - One-direction loss on a pair
Symptom. One stream of a pair loses packets, the reverse stream is clean - for example K-L11 to C-L21 in VLAN 1314, or production VLAN A to B in L3-DCFW.
Hypotheses.
- Firewall classes: a rule, anti-spoofing or NAT setting covers only one direction. The reverse stream is a separate UDP flow (other source port) and needs its own permit.
- Routed classes: the routing device cannot deliver to the destination client - its ARP entry for the destination TRex address is missing, because the EMU client at the destination AP is missing or its VLAN is not mapped there.
- A lossy ECMP member: each direction is a different flow and is hashed independently; a spine-leaf link with errors loses only the flows hashed onto it - often one direction of a pair, and some other streams.
- Unidirectional physical errors on an AP link or the TX-to-TX link: all streams entering through that link in that direction are affected, not just one pair.
- Destination MAC learned in the wrong place (a duplicate MAC elsewhere) - see I5.
Checks.
| # | Where | Command | What it tells you |
|---|---|---|---|
| 1 | Grafana | Which other streams share the source AP and direction, or the destination AP? | Several: hypothesis 3 or 4. Only this one: 1, 2 or 5 |
| 2 | TRex (Python) | get_pgid_stats([pg_forward, pg_reverse]): TX, RX, latency err_cntrs |
Constant rate of loss (policer, rule) or bursts (link errors) |
| 3 | sw-rzk-BL |
display arp vpn-instance VPN-CORE |
ARP entry for the destination TRex address present? (hypothesis 2) |
| 4 | TRex (read-only, --emu) |
emu_show_client_info -p 1 --vlan 3204 1314 --tpid 0x8100 0x8100 --mac 02:54:52:0a:05:22 |
Destination client exists and resolved its gateway |
| 5 | Leafs at both ends | display l2vpn mac-address vsi VPN-1314 |
Destination MAC learned on the expected AP port or tunnel (hypothesis 5) |
| 6 | Path devices | display counters inbound interface, display interface <port> |
Error counters on AP links, TX-to-TX link, spine-leaf uplinks (hypotheses 3, 4) |
| 7 | firewall team | Logs for the TRex rules | Drops in one direction (hypothesis 1) |
verified L3 IP Services CR PDF p. 33; VXLAN CR PDF p. 13; L2 CR PDF p. 42
(display counters), pp. 47-50; TRex EMU console options from trex-core parsing_opts.py
confirm on the bench for the exact namespace key.
Conclusion and action.
- Rule or anti-spoofing: firewall team corrects the rule for the reverse direction.
- ARP at the routing hop: restore the client or the VLAN mapping at the destination AP (S2/S3 steps).
- Lossy link: a production finding - the same link drops production flows hashed onto it. Escalate with the interface and its error counters.
I5 - MAC-move alarms on a Leaf (duplicate TRex client MAC)
Symptom. The network team reports that a MAC beginning with 0254-52 moves between ports - in the records of
display mac-address mac-move, or as MAC/4/MAC_FLAPPING syslog messages where mac-address notification mac-move is
enabled (it is disabled by default). There may also be ARP conflict messages for a 10.3.14.1xx address on
sw-rzk-BL. TRex shows dup or out_of_order counts, intermittent loss or latency jumps on some streams.
Decode the MAC first. Monitoring clients read 0254-52II-VVVV: II is the AP index (01-10 hex), VVVV the
VLAN. 0254-5203-0522 is the monitoring client of AP index 3 (K-L21) in VLAN 0x0522 = 1314. Lab ports have fixed MACs
instead - 0254-52f0-0004 (p4) to 0254-52f0-0007 (p7), independent of VLAN and pin - and such a MAC must appear
behind exactly one AP: the one its lab port is pinned to. You now know where the MAC should be.
Hypotheses.
- Inventory error: two APs with the same index - the same MAC and IP appear at two APs.
- Lab client with a monitoring address: a lab test on a pinned port uses a monitoring MAC/IP instead of the fixed lab-port MAC and the lab IP (.151 + AP index - 1).
- Same client sent from two TRex ports: a stream table error places one client's streams on p0 and p1; the MAC moves on the TX switch between XGE1/1/21 and XGE1/1/22 (visible on the TX switch, not on the Leaf).
- Two APs in one S-VLAN on a TX switch (a wrong PVID): a real Layer 2 loop between two Leafs outside the fabric. Many MACs - production MACs too - start moving. Emergency.
Checks.
| # | Where | Command | What it tells you |
|---|---|---|---|
| 1 | Leaf | display mac-address mac-move |
Move records (MAC, VLAN, current and source port, time, count) |
| 2 | Leaf | display l2vpn mac-address vsi VPN-1314, display evpn route mac vsi VPN-1314 |
Where the MAC is learned now and which VTEP advertises it |
| 3 | TX switches | display mac-address mac-move, display mac-address vlan 3103 |
Moves between TRex trunk ports (hypothesis 3) |
| 4 | TX switches | display vlan <S-VLAN> for the S-VLANs involved |
Exactly one Leaf-facing untagged port per S-VLAN (hypothesis 4) |
| 5 | TRex (read-only) | emu_show_all on trex-mon; ./trex-console -r -p 4601 --async_port 4600, then profiles on trex-lab |
The MAC in two namespaces? Lab traffic running? |
verified L2 CR PDF pp. 14-15 (display mac-address mac-move), pp. 24-25
(mac-address notification mac-move, default disabled, MAC/4/MAC_FLAPPING), p. 11, p. 193; VXLAN CR PDF p. 13; EVPN CR
PDF p. 23. Whether moves of a VSI MAC between a service instance and a tunnel appear in display mac-address mac-move
confirm on device; display l2vpn mac-address and display evpn route mac show the
current location in any case.
Conclusion and action.
Two Leaf-facing ports in one S-VLAN is an emergency
If many MACs - production MACs included - move between two Leafs, assume hypothesis 4: the TX switch bridges two APs
and creates a Layer 2 path parallel to the fabric for every VLAN both APs carry. Shut the offending AP port on the TX
switch at once; it affects only measurements. Correct the PVID and verify with display vlan before undo shutdown.
- Hypothesis 4: as above.
- Hypothesis 2: stop the lab test (
systemctl stop trex-lab.service), correct the lab addressing. - Hypotheses 1 and 3: correct the inventory or the stream table and re-create the affected groups.
- The MAC tables settle as soon as the duplicate stops; stale entries age out within 300 s.
I6 - Jitter increase on the inter-DC streams
Symptom. jitter_us and the interval maximum of the L2 inter-DC streams (and of the routed streams from RZC
sources) rise during certain hours; the average rises slightly; no loss. Intra-DC streams are normal; the DSCP streams
EF, AF41, CS1 and BE rise together.
Hypotheses.
- DCI load: the 2 x 40G
Route-Aggregation1carries production traffic (backups, replication); queues build up at busy times. - One DCI member down: all inter-DC traffic on one 40G member.
- A lab test across the TX-to-TX fibre (shared by monitoring and lab traffic) - but then the intra-RZC streams would suffer too.
- Instrument: high RX CPU on
trex-mon- but then all streams would show it.
Checks.
| # | Where | Command | What it tells you |
|---|---|---|---|
| 1 | Grafana | Only DCI-crossing streams? Same hours every day? | Pattern points to hypothesis 1 |
| 2 | sw-rzk-BL, sw-rzc-BL |
display counters rate outbound interface HundredGigE1/2/1 (and 2/2/1) during the period |
Utilisation of each DCI member |
| 3 | sw-rzk-BL |
display link-aggregation verbose route-aggregation 1 |
Both members selected? (hypothesis 2) |
| 4 | server | systemctl is-active trex-lab trex-lab-astf |
Lab test running? (hypothesis 3) |
| 5 | TRex (read-only) | stats -g, stats -c |
RX CPU (hypothesis 4) |
verified L2 CR PDF pp. 43-44, 127-128. The DCI members on sw-rzk-BL also export sFlow
samples (sflow flow collector 1, collector 10.10.252.159 in the running configuration); the network team can use them
to see which traffic fills the DCI at those hours.
Conclusion and action. Jitter that follows the DCI load without loss is information for capacity planning, not an incident; record the time pattern and keep the jitter rule at information severity. EF rising together with BE confirms that nothing in the path prioritises by DSCP - consistent with a fabric configuration without QoS trust or scheduling.
I7 - Everything red
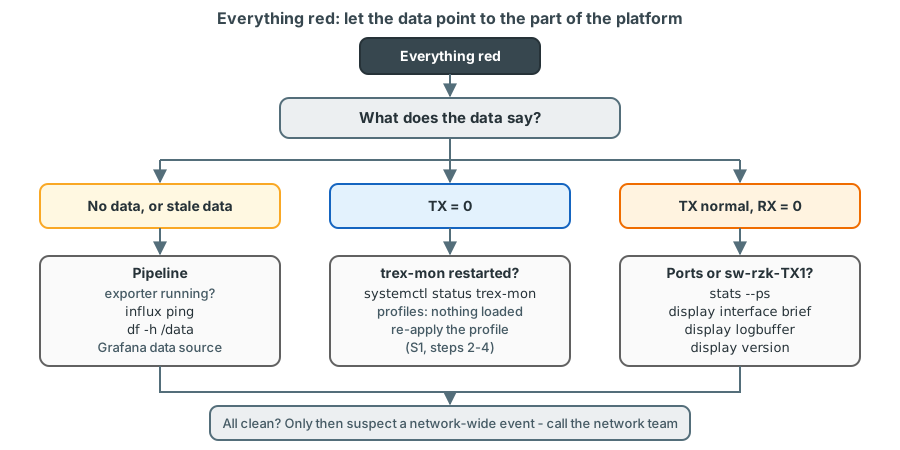
Symptom. The Overview shows all streams down, or no data at all; many alerts fire at once.
Hypotheses.
- Exporter stopped or InfluxDB unavailable (for example
/datafull): dashboards show "No data" or stale values. trex-monrestarted (server reboot, crash) and the monitoring profile was not re-applied: TX = 0.- TRex ports p0/p1 down or
sw-rzk-TX1down: TX normal, RX = 0 for every stream. - Grafana data source or Grafana itself broken: panels show errors.
- A network-wide event - which the network team would see in their own monitoring at the same time.
Checks, in this order.
systemctl status trex-mon
systemctl show -p NRestarts trex-mon
tail -n 50 /var/log/trex/trex-mon.log
grep 'queues mode' /var/log/trex/trex-mon.log | tail -n 1   # after a restart: ONE_QUE
influx ping
df -h /data
systemctl status influxdb grafana-server
chronyc tracking
trex(read-only)> stats -g
trex(read-only)> stats --ps
trex(read-only)> profiles
<sw-rzk-TX1> display interface brief
<sw-rzk-TX1> display logbuffer
<sw-rzk-TX1> display version
Then the exporter (planned unit trexctl-exporter.service and its log). verified TRex console
options as in Chapter 20; L2 CR PDF p. 56; NMM CR PDF p. 423; Fundamentals CR PDF p. 244
(display version, which includes the uptime).
Conclusion and action.
- Profile not re-applied after a restart (TX = 0): re-apply it (S1 steps 2-4). Planned: the supervisor thread of the
exporter detects the
trex-monrestart (server uptime reset, oractive_streamsfalling to zero while a profile is recorded as active in/data/trexctl/state/), runstrexctl apply -p <active profile>once the server accepts connections again and restarts the gateway-MAC tracker. After any restart also confirm the queue modeONE_QUEin the log (otherwise the latency values are not accurate) and the host protection, because every TRex start stops firewalld (Chapter 20). /datafull: free space, check the retention policies and the downsampling task, then confirm that InfluxDB writes again.sw-rzk-TX1rebooted or ports down: wait for the reload and verify the AP and trunk ports; investigate the cause.- TRex restarting in a loop: see Chapter 25.
None of these affects production, but while the instrument is down the network is not being watched: tell the network team that the monitoring is blind until the instrument is fixed, and annotate the gap.
Key takeaways
- An outage is measured by counting, not timing: outage = lost packets / pps, precise to one packet interval; the time position comes from the per-interval series.
- Raise only the groups whose paths cross the maintained element to 1000 pps, keep firewall streams at 100 pps or less, and restore everything afterwards.
- An AP on a rebooted IRF member shows the member's whole downtime by design; fabric convergence is read on APs of the surviving member.
- Before/after validation compares matching time windows per class and pair against criteria agreed before the change.
- Work incidents from the scope of the affected streams: the elements they share are the hypotheses. Intra-RZC streams never cross the DCI.
- A clean latency step on one firewall class, with ARP conflict messages for
10.9.0.22on the Border Leaf, is the signature of a firewall member change. - After a firewall failover, streams sent to a firewall member MAC (L3-DCFW, the zone side of L3-ENTFW and DSCP) stay
lossy until they are rebuilt with the new MAC; read the failover gap on the streams sent to the
sw-rzk-BLgateway. EMU must learn the new MAC first - at once from a gratuitous ARP request, otherwise at its periodic query, whichemu_arp_cmd_query ... --garp offforces; the planned gateway-MAC tracker automates the rebuild. - A monitoring MAC
0254-52II-VVVVdecodes to AP index and VLAN, a lab-port MAC0254-52f0-000xbelongs to one lab port and one pin; two Leaf-facing ports in one S-VLAN is an emergency. - "Everything red" is almost always the instrument: split by no data, TX = 0, or RX = 0.
Check your understanding
1. During an IRF member reboot on sw-rzk-L21 the K-L21 streams lose 210 000 packets each at 1000 pps. A colleague concludes that the fabric needed 210 s to converge. What is wrong?
The AP K-L21 is a single link to one IRF member. If that member was rebooted, the AP link was down for the whole reboot, and 210 s is the member's downtime, not the fabric's convergence time. Fabric convergence must be read on streams whose AP stays up - an AP on the other member, or other Leafs whose paths cross the affected element.
2. A stream at 1000 pps lost 347 packets during a DCI member failure. What was the outage, how precise is the value, and why can you not say exactly when it started from Grafana alone?
347 ms, precise to about one packet interval (1 ms), because it comes from counters. The start time is known only to the exporter's sampling interval (2 s by default), because the per-interval drop series only shows in which interval the packets were lost. Device log timestamps narrow it down.
3. Why do you keep the L3-ENTFW streams at 50 pps during a firewall failover test instead of raising them to 1000 pps?
Streams through firewalls are limited to 100 pps per stream by the design guard rails: each stream is a firewall session and the firewall is a production device. 50 pps already gives 20 ms resolution, which is enough to measure a failover; higher rates need the firewall team's agreement.
4. All RZC streams lose packets, including C-L11 to C-BL. Why can you exclude the DCI, and what do you check next?
C-L11 to C-BL is an intra-RZC L2 stream that never crosses the DCI. It shares p1, the TX-to-TX fibre and
sw-rzc-TX1 with the other RZC streams: check the TX-to-TX interface counters and optics, p1 and its switch port,
sw-rzc-TX1, and whether a lab test runs across the fibre.
5. The L3-ENTFW latency jumps by a constant amount at 14:10 and stays there; sw-rzk-BL logs an ARP conflict for 10.9.0.22 at the same time. What is the most likely explanation and whose action is needed?
A firewall cluster member change: the member answering for the next hop 10.9.0.22 changed, very likely to the
member in the other data centre, so the path now crosses the DCI. If the failover was planned, annotate it; if not,
the firewall team must investigate why the cluster failed over. In both cases check the resolved firewall MAC of the
zone clients: the zone-side streams still carry the old member MAC and must be rebuilt (planned: by the gateway-MAC
tracker, which writes the event gateway_mac_changed).
6. K-L11 to C-L21 loses 0.2 % of its packets constantly, C-L21 to K-L11 is clean, and two other streams leaving K-L11 towards RZC also lose packets. Which hypothesis does this favour and what do you check?
Several streams in the same direction from the same source point to a shared element in that direction - a lossy
ECMP member or unidirectional errors - rather than a pair-specific rule. Check display counters inbound interface
and display interface on the K-L11 AP link, the Leaf uplinks, the DCI members and the TX-to-TX link.
7. 0254-52f0-0007 appears on two Leafs. Who owns this MAC, and what is the most likely cause?
0254-52f0-00xx is a fixed lab-port MAC, independent of VLAN and pin: 07 = lab port p7 (pinned to C-L21 by
default). A lab port's MAC enters the fabric only at the AP its port is pinned to, so it must appear behind exactly
one AP. Most likely the MAC was used as the source MAC on a second lab port (a copied --smac), or a test was started
from the wrong port after a re-pin - stop the lab test and check the pinning and the stream MACs.
8. The Overview shows no data for the last 20 minutes, but stats -g in a read-only console shows TX = RX = about 20.6 kpps. Where is the problem?
In the pipeline behind TRex: the measurement runs, but the data does not reach Grafana. Check the exporter, InfluxDB
(influx ping, df -h /data) and the Grafana data source. The network is not the issue.
References
- TRex stateless support guide, https://trex-tgn.cisco.com/trex/doc/trex_stateless.html - "Per stream latency/jitter/packet
errors" (error counters), "Dynamic multiple profiles". TRex STL Python API
get_pgid_stats(); trex-corestl/trex_stl_stats.py(counters relative to the client's reference sample),utils/parsing_opts.py(-tis the last option ofstart),emu/trex_emu_client.py(show_client_info,dgw),emu/emu_plugins/emu_plugin_arp.py(arp_cmd_query,cmd_query),src/trex_modes.cpp(log line "set dpdk queues mode to ..."). trex-emu sourcesrc/emu/plugins/arp/arp.go(ARP requests learned at once, broadcast replies dropped, periodic query timer). - HPE FlexFabric 5950 Layer 2-LAN Switching Command Reference R630x (PDF pages):
display mac-address11,display mac-address mac-move14-15,mac-address notification mac-move24-25,display counters42,display counters rate43-44,display interface47-50,display interface brief56,display link-aggregation verbose127-128,display vlan193,display qinq277,display lldp neighbor-information355. - HPE FlexFabric 5950 R630x command references: VXLAN CR
display l2vpn mac-address13-15,display l2vpn service-instance15-17; EVPN CRdisplay evpn route mac23; L3 IP Services CRdisplay arp vpn-instance33; L3 IP Routing CRdisplay ip routing-table26,display ospf peer181; Fundamentals CRdisplay version244,display transceiver alarm289-290,display transceiver diagnosis290-291; Network Management and Monitoring CRdisplay logbuffer423; Virtual Technologies CRdisplay irf4. - LVR diagnostic file
diag_sw-rzk-BL_20250217-163816.txt,display logbuffer(ARP/4/ARP_DUPLICATE_IPADDR_DETECTfor10.9.0.22, October 2024) and ARP table (10.9.0.22 and 10.9.0.35 resolved to MACs of the RZC members in February 2025); running configurations February 2025 (Route-Aggregation1members, sFlow, NTP, OSPF 1 in VPN-CORE onsw-rzk-BL). - Grafana documentation, "Query and transform data - Time range overrides"; InfluxDB OSS v2 documentation, Flux
sum(),map(),first(),quantile().