TRex Monitoring Platform - Training
This course teaches you everything you need to understand, operate and support the TRex network monitoring and performance-test platform for the LVR-InfoKom data centres Kalk (RZK) and Chorweiler (RZC).
It assumes that you are an experienced network engineer: you know Linux, HPE Comware, VLANs, VXLAN/EVPN, routing and firewalls. It assumes no prior knowledge of TRex, DPDK, TRex EMU, InfluxDB or Grafana - those are explained from first principles, and always with the question why is it built this way?
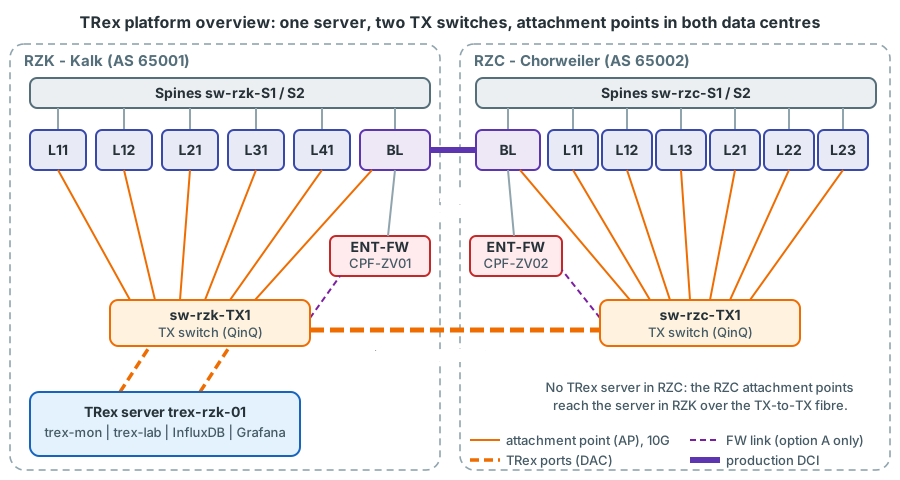
What the platform does
- Permanent monitoring. Small, continuous test streams (tens of kpps in total) run between attachment points inside production VLANs, across the data-centre interconnect, through the Border Leaf routing and through the firewalls. For every stream TRex measures loss, and for selected streams one-way latency and jitter. Grafana shows the results and raises alerts.
- On-demand tests. Line-rate throughput tests, soak tests, convergence measurements during maintenance windows and stateful (TCP) firewall tests - on separate TRex ports, so that the permanent monitoring is never interrupted.
How the course is organised
| Part | Content | Read it when |
|---|---|---|
| I - Foundations | Measurement basics, TRex architecture, stateless streams, statistics and latency, EMU, ASTF, InfluxDB, Grafana | First - this is the toolkit |
| II - The LVR platform | The fabric as TRex sees it, the TX-switch/QinQ design, attachment points, traffic classes, firewall zone, monitoring design, server build, orchestration, dashboards | Second - this is our system |
| III - Operations and scenarios | Daily operation, step-by-step scenarios, production safety, troubleshooting | When you operate or test |
| Appendices | Cheat sheets, reference configuration, glossary, open decisions and the plan's history, sources | As reference |
Start with How to use this course.
Status of the design
The platform is in the planning phase (plan document v0.92, 14 October 2026). This course teaches the verified design. Where a design question is still open (for example how the firewall test zone is connected - the plan recommends option B, the existing transfer VSI 4003, and uses it as its default), the course presents the options and their consequences in boxes marked Open decision. The open decisions, the items still to be confirmed on the devices, the plan's history (D.3 to D.5) and its remaining open points are collected in Appendix D.
Edition
This site is the course: interactive animations with an MP4 video of each one (link in the animation's control bar, all of them on the page Animation videos), search and collapsible answers. It also works when opened directly from the folder, without a web server or internet access.